
How to Use Seeking Alpha Portfolios
According to AI, there are about 4,873 ETFs US ETFs. How can you weed through that kind of list? In addition, about 6,700 stocks are listed on the NYSE and Nasdaq combined, and about 13,000 listed companies if you include OTC markets. If we only consider major exchanges, the figure is 6,700. On top of that, about 8,588 long-term mutual funds are currently in the U.S. market.
Seeking Alpha doesn’t provide information about every possible investment. However, I have yet to discover an investment that isn’t represented that is of even the smallest significance. For Seeking Alpha you can watch 4,254 stock investments. I would be overwhelmed before starting. Add to that 3,833 ETFs and the task becomes ridiculously difficult.
This is where Seeking Alpha and Fidelity’s Trader+ can help me focus.
Wayne-Watch on Seeking Alpha
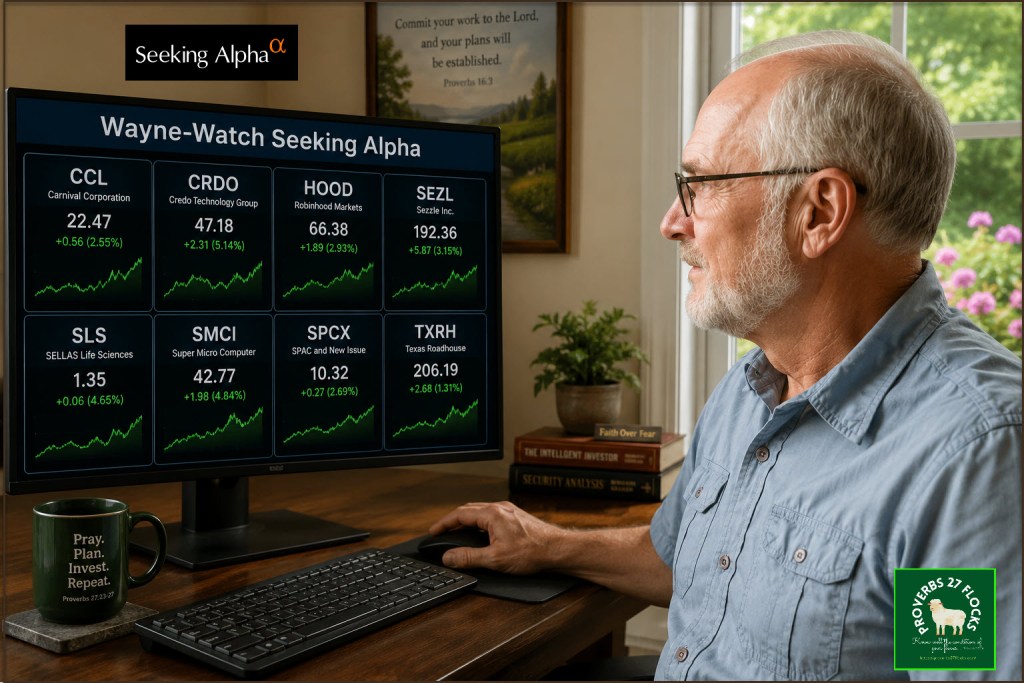
I set up a “portfolio” that includes investments of interest to me using other Seeking Alpha tools to compile the list. Some of the ideas have come from other investors, including our son. Some have come as the result of someone asking me questions like “what do you think of the XYZ company?” My current Wayne-Watch list includes these eight stocks: CCL, CRDO, HOOD, SEZL, SLS, SMCI, SPCX, and TXRH.
I may or may not own shares of any of these. By way of example, I do own shares of SMCI. I also have cash covered PUT options contracts on SMCI and covered call contracts. However, I don’t own shares of HOOD or TXRH at the present time. I also don’t own shares of SPCX, but I do trade PUT options on that company.
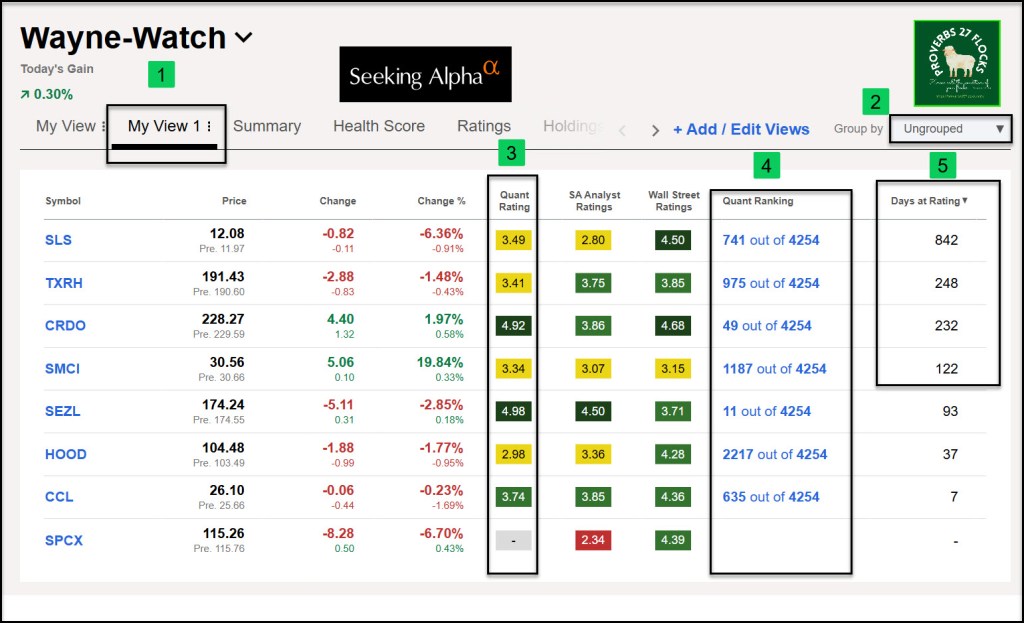
This type of “portfolio” makes it far easier for me to quickly review these companies. The first image is a view I created on Seeking Alpha so that I can see important information like the QUANT rating, the QUANT ranking, and the days the ranking has been in force.
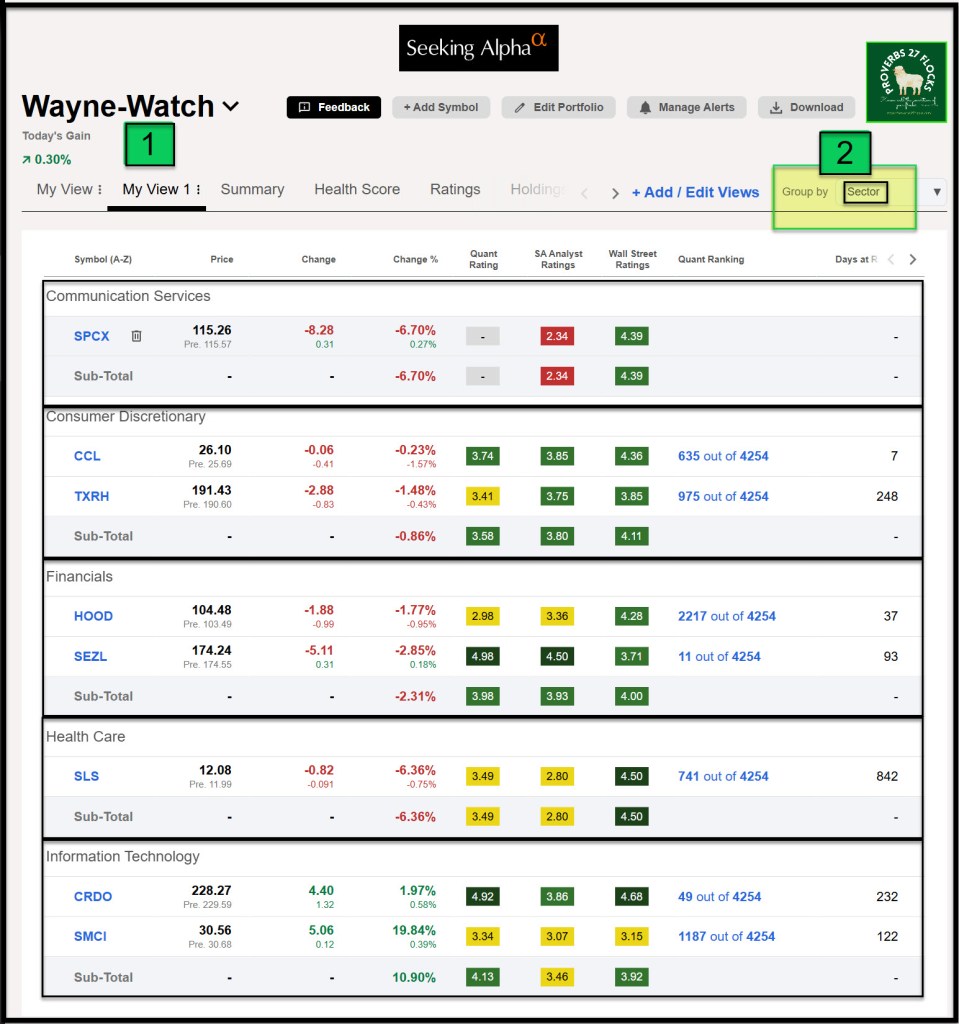
This next image is the same set of data. However, I changed the “Group by” setting to “SECTOR” so that I could see the sectors of the investments in this watch list.
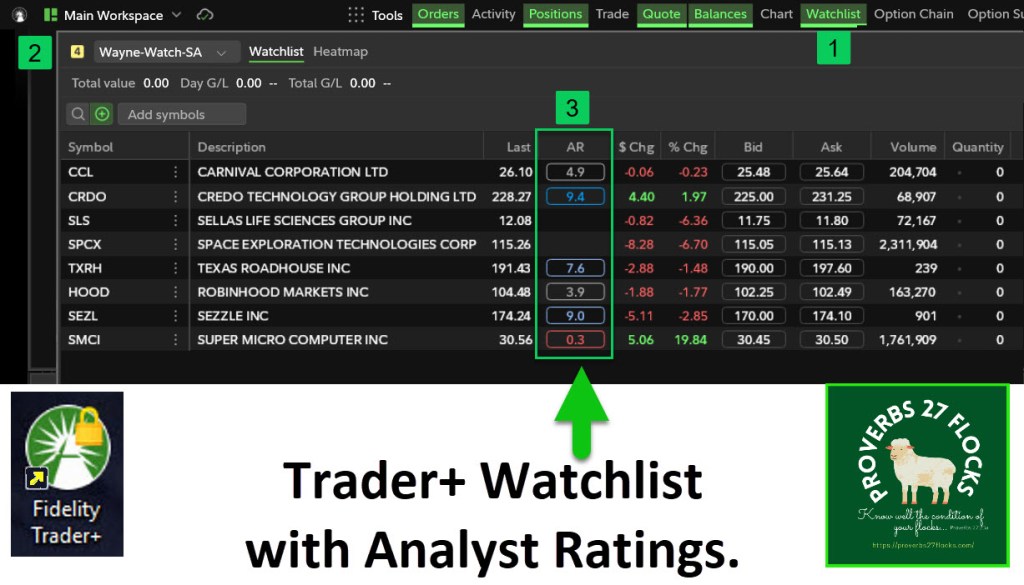
Wayne-Watch on Trader+
You can do similar things with Fidelity Investment’s Trader+ software. I created an identical list of ticker symbols using the Watchlist tool. I added the columns I wanted to see, including the “Description” and the analyst ratings (AR). The columns can be arranged in any order that you desire. This is a powerful way to focus on the things you own or the things you want to potentially own or for options trading opportunities.
Seeking Alpha Subscription Information
Of all of the resources I use, the most helpful is Seeking Alpha. The Seeking Alpha QUANT rating is a huge factor in my investment success. If you decide to explore a Seeking Alpha subscription, please use the following link. Seeking Alpha
SEEKING ALPHA INFORMATION AND SUBSCRIPTION

You can also scan this QR Code to get the same information.

Past performance does not guarantee future results, Seeking Alpha does not provide personalized advice, and it is not a registered investment adviser.
We accept advertising compensation from companies that appear on our site. This website represents my opinions, which may not reflect those of Seeking Alpha, and does not constitute an investment recommendation or advice.
If you have any questions or problems getting connected to Seeking Alpha, reach out to them with this email address: subscriptions@seekingalpha.com


Hi Wayne, I guess this is a good time to ask- what do you think of Dominos DPZ? : )
Thanks!
Matt
LikeLiked by 1 person
I think it is expensive and I’m not a fan of restaurant stocks in general. I own 100 shares of DRI as my one exception.
Here is what Seeking Alpha says in a nice summary:
Growth C-
Profitability A+
Momentum D
Revisions D
Sector Metrics Comparative Analysis:
Valuation: DPZ is considerably overvalued, with its Price/Sales ratio at 2.15, significantly higher than the sector median of 0.93. This indicates the stock is priced at a premium compared to its peers.
Growth: The company exhibits moderate growth, with a revenue increase of 5% year over year, slightly above the sector’s 4%. However, its forward revenue growth of 4% lags behind the sector’s 4.4%, indicating slowing expansion.
Profitability: DPZ demonstrates excellent profitability, with an EBITDA margin of 20%, well above the sector’s 11%. This reflects strong efficiency in converting sales into profits.
Momentum: Stock momentum is weak, with a 1-year price performance decline of 29%, far below the sector’s decrease of 0.4%. This suggests a bearish sentiment among investors.
Revisions: Earnings revisions are concerning, with 26 downward EPS revisions in the last three months and no upward revisions. This negative outlook reflects analysts’ pessimism about DPZ’s future earnings potential.
LikeLike
Thanks Wayne! Would you mind sharing the comparable stats for DRI?
LikeLiked by 1 person
Here are the comparable notes from Seeking Alpha for DRI. NOTE: My cost basis for DRI is $141.35 per share. Therefore, this is a long-term holding that has done well for me.
Darden Restaurants, Inc. (DRI) is rated Hold. The company shows a mixed performance across valuation, growth, profitability, momentum, and revisions, resulting in a neutral outlook.
Valuation C-
Growth D
Profitability A-
Momentum C+
Revisions D+
Sector Metrics Comparative Analysis:
Valuation: DRI’s valuation indicates a premium with a Price/Book ratio of 10.04, significantly higher than the sector median of 2.09. However, the Dividend Yield of 3.16% is attractive compared to the sector’s 2.38%, suggesting good income potential.
Growth: DRI exhibits robust growth, with its EPS Diluted Growth Year-over-Year at 18%, vastly outperforming the sector’s 3%. This highlights the company’s strong profit expansion.
Profitability: The company demonstrates impressive profitability, with a Net Income Margin of 9%, more than doubling the sector’s 4%. This reflects DRI’s efficiency in converting revenue into profit.
Momentum: DRI’s stock momentum has been challenging, with a 1-year price performance of -7%, compared to the sector’s -3%. This indicates a bearish sentiment and declining investor confidence.
Revisions: Recent earnings forecasts are concerning, with 21 downward EPS revisions in the past three months compared to only 4 upward, reflecting a negative outlook among analysts.
In summary, Darden Restaurants, Inc. (DRI) displays strong profitability and growth but faces challenges in valuation and stock momentum. The negative trend in earnings revisions suggests potential headwinds, leading to the Hold rating.
LikeLike