

Before studying ETF’s remember some principles
Know the Purpose
When buying a field, consider the purpose: “She considers a field and buys it; with the fruit of her hands she plants a vineyard.” Proverbs 31:16 An ETF is like a field. Each type can grow investment dollars differently. Some ETFs are very focused on a sector like consumer discretionary or technology, an investing style (dividend growth) or a market index like the S&P 500. Each will grow differently.
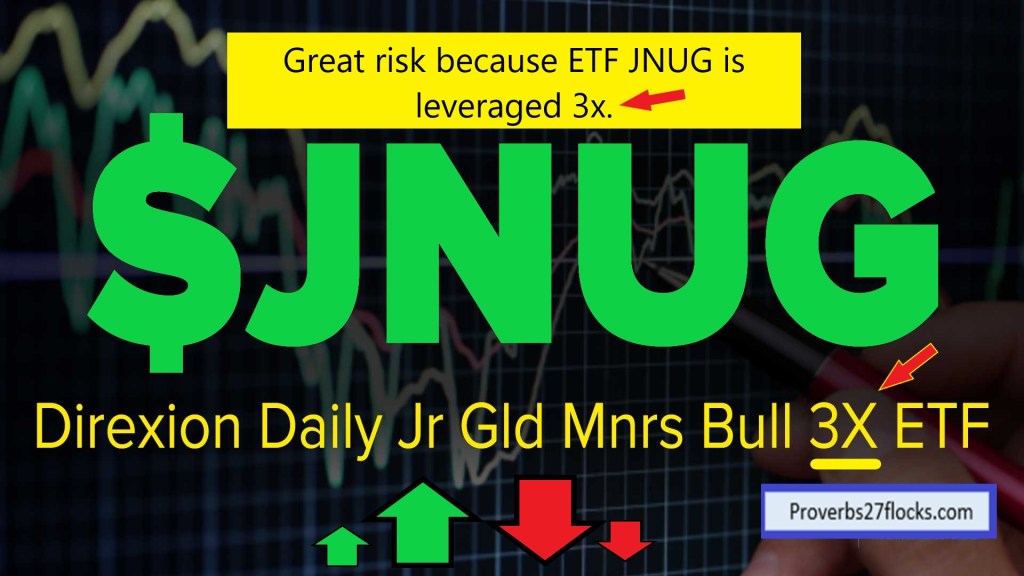
Beware of Leveraged and inverse ETFs
Plan diligently and Research thoughtfully: “The plans of the diligent lead surely to abundance, but everyone who is hasty comes only to poverty.” Proverbs 21:5 Know what you are buying. Study each investment to see if it meets your criteria. This means you set criteria in advance! Some ETFs can be quite dangerous. For example, ETF JNUG (Direxion Daily Junior Gold Miners Index Bull 3x Shares ETF) is highly speculative and risky. When you see 2x or 3x in a fund name, it means something. Leveraged and inverse ETFs provide magnified (e.g., 2x, 3x) or inverse (e.g., -1x, -2x) exposure to popular benchmarks for equities and other asset classes like commodities (Gold, Silver). These can create significant profits and significant losses. Haste is not a good thing for the sensible investor.
Types of Investments – ETFs
What is an ETF?
An ETF is a fund that contains different types of investments, depending on the stated purpose of the ETF. Never assume the name of the fund is a good indicator of the contents. For example, not all dividend growth ETFs are necessarily good dividend growth funds. You can buy an ETF that focuses on a sector (energy, health care, utilities) or on an index like the S&P 500. There are small cap ETF’s and there are mid-cap and large-cap ETFs as well. Some ETFs focus on emerging markets and others are global, Asian, or European in focus. In reality, there is probably an ETF for almost every type of investing interest or strategy.
ETFs or Mutual Funds?
Why Active Management is Questionable
Why would someone invest in an ETF rather than a mutual fund? Initially one of the big reasons was lower expense ratios. ETFs tend to track an index and tend to have lower position turnover. Therefore, the ETF management team doesn’t have to do a lot of work. They build their ETF and then just tweak it as necessary. Many mutual funds have “active management.” That means there is usually more buying and selling on the part of the fund manager, and that increases the costs. It doesn’t necessarily increase the fund’s performance, but the fund manager would like the investor to think that they will provide better-than-market results. Most active managers underperform the market.
Buy Before You Know the Price?
Another reason I prefer ETFs is that they can be traded at a known price. An investor who enters an order to buy or sell a mutual fund at 9AM in the morning, really doesn’t know what price they will pay for the investment. You can say you want $5,000 of the mutual fund, but you don’t set the purchase price. The price is set after the close of the market, once the share prices of all of the holdings are known and totaled. This is OK for long-term investors, but I still like to enter an order to buy a specific number of shares at a specific price using a buy limit order.
Benefits of ETFs
ETFs, as mentioned previously, generally have lower expense ratios. Most of the good ones have an expense ratio of less than 0.10%. Of course, there are now some mutual funds with 0% expense ratios, so there are a few good choices for the astute investor.
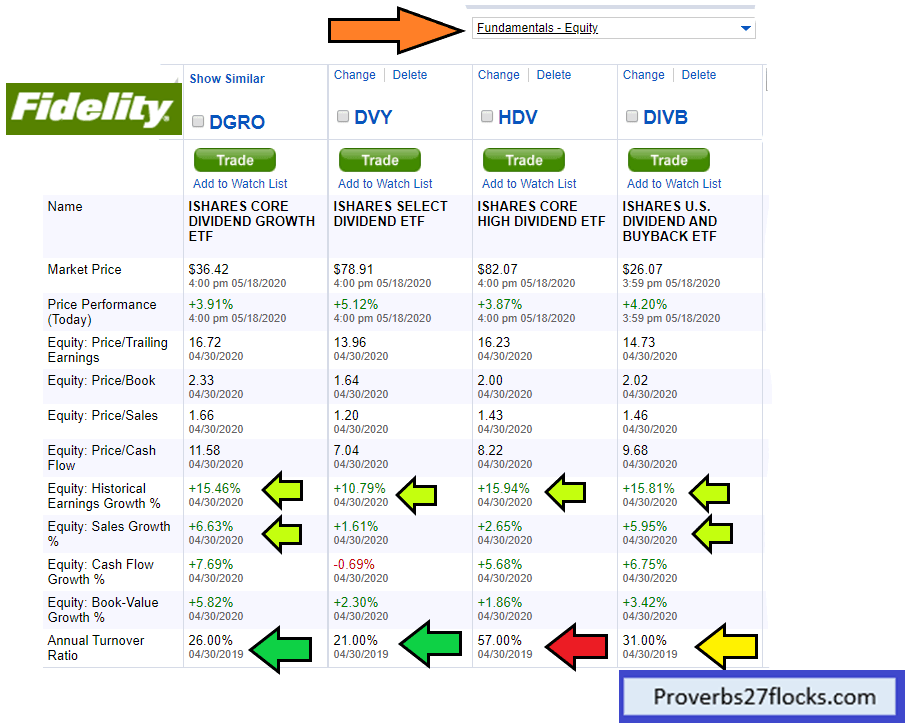
The other benefit of the ETF, in general, is the lower turnover ratio. If an ETF or a mutual fund has a turnover ratio of 50%, it means that the fund manager has bought/sold 50% of the holdings in the year. That, in my opinion, is almost as bad as day trading. If a good investment is chosen for the fund, there is little reason to buy and sell aggressively during the year. Most of the ETFs I purchase have a turnover ratio of less than 10-20%.
Rating ETFs
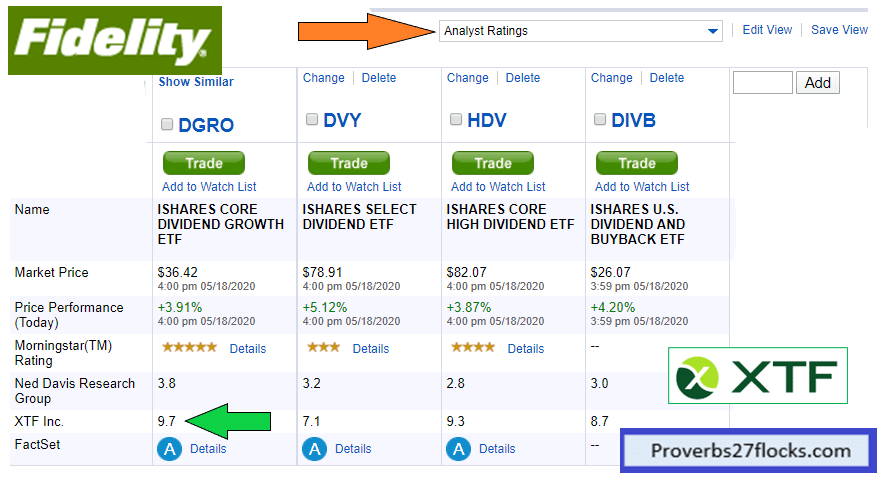
Wise investors seek advice from various sources when buying an investment. There are several tools that I use when considering an ETF. One of them are the ratings provided on the Fidelity Investments web site. My favorite is XTF. https://www.xtf.com/
For example, if you wanted to understand the XTF rating for VYM, you could find information at XTF’s web site. When I looked at VYM today, I see their rating is 9.2 out of 10.0. Their rating is based on the structural integrity and investment metric giving a total between 0-10. Ten is the best. VYM’s Rating at XTF https://www.xtf.com/ETF-Ratings/vym
You can also get an “average broker recommendation” from the ETFChannel web site. VYM has three stars (Buy = 2.90 out of 4) based on data provided by Zacks Investment Research. Here is a link for VYM at ETFChannel: VYM https://www.etfchannel.com/etfs/?symbol=vym
Comparing ETFs Using
ETFReplay, Fidelity Investments and ETF.COM
When you find a sector or type of ETF you like, sometimes the easiest way to find similar ETFs is to use Google. For example, if I Google “ETFs like VYM” I will see some suggestions from Vanguard including mutual fund VHDYX and ETF IVV. IVV, for example, is the iShares S&P 500 Index. So VYM is similar, in some respects to IVV. Another good tool for comparing dividend growth is this web site: ETFREPLAY. If you enter in the ticker symbols for VYM and IVV you can see graphs and tables comparing their dividends. https://www.etfreplay.com/yield.aspx

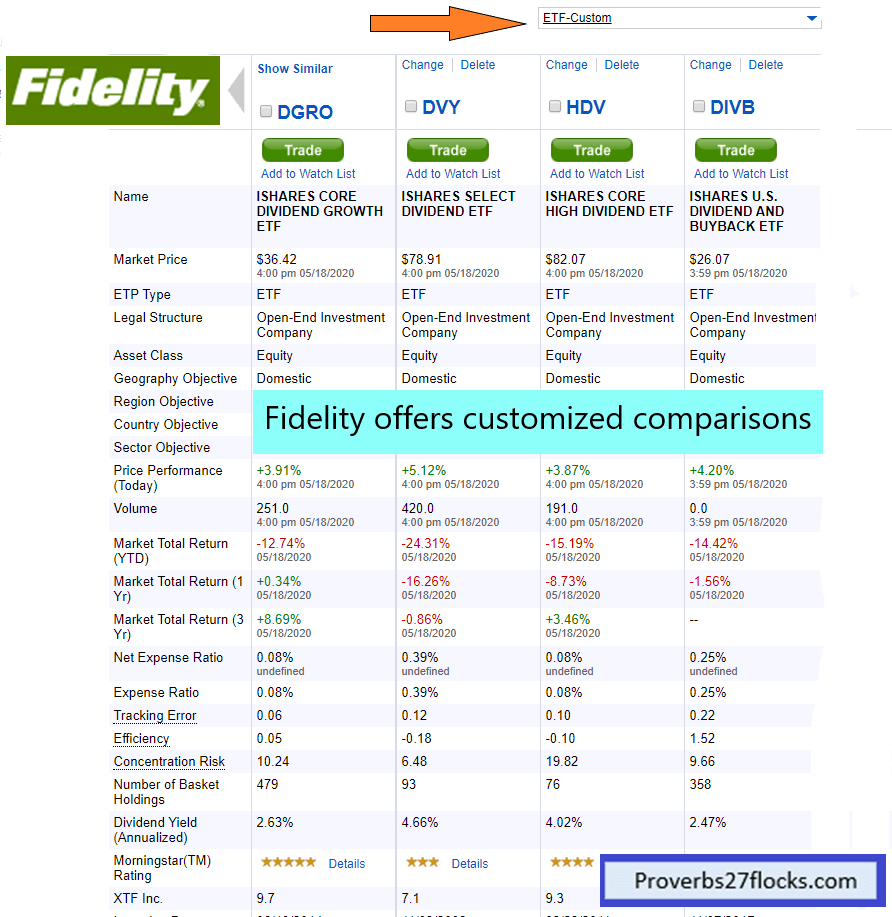
Another good comparison tool is on Fidelity Investments. When you enter the ticker symbol for the ETF, you can compare ETFs. You can enter your own choices, or you can enter a single ticker and then select “Show Similar” on the compare tool. Link: https://research2.fidelity.com/fidelity/screeners/etf/comparison.asp?symbols=VYM
The following are examples of comparisons I ran using Fidelity’s tool.


ETF.COM is a web site that focuses on ETFs. They claim they are “the world’s leading authority on exchange-traded funds, ETF.com has delivered clear, independent and authoritative news, analysis and education about ETFs online and in print since 2001. The firm’s marquee properties are its website, ETF.com, and its print publication, ETF Report. ETF.com is a fully owned, editorially independent subsidiary of Cboe Global Markets.” Investors can learn more about VYM at ETF.COM.
https://www.etf.com/VYM#overview
You can also compare two different ETFs using this tool: https://www.etf.com/etfanalytics/etf-comparison-tool/VYM-vs-DVY
ETF Providers
In 2019 there were already more than 2,000 ETFs. However, it is my preference to focus on just some premier providers. Those providers are Vanguard, Charles Schwab, Fidelity Investments and Blackrock’s iShares. According to one source, the big three in the US are: Blackrock’s iShares, State Street’s SPDR, and Vanguard. For example, I focus my non-stock IRA investments on two ETFs: VYM from Vanguard and SCHD from Schwab. However, I also like iShares ETFs DGRO and DVY.
When Will I Receive the Dividends?


Some Dividend ETFs
My favorites for dividend income, as mentioned earlier in this post, all feature decent dividend growth, good diversification, and low expense ratios.
VYM from Vanguard has an expense ratio of 0.06% and a current yield of 3.52%. This is my largest holding with more than 800 shares.
SCHD from Charles Schwab has an expense ratio of 0.06% and a current yield of 3.58%
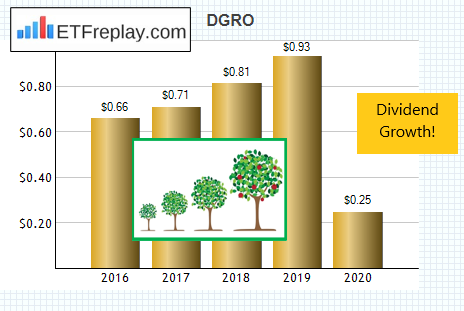
DGRO from iShares has an expense ratio of 0.08% and a current yield of 2.64%.
DVY from iShares has an expense ratio of 0.39% and a current yield of 4.56%.
