

Anatomy of a Trade
The best way to illustrate my method for completing the sale of a short-term position is through pictures. The following illustrate how I sold my BTG shares yesterday.
Here is what I do (followed by images to show what I look at):
- I review my cost basis by lot. I purchased two lots on February 28, 2020.
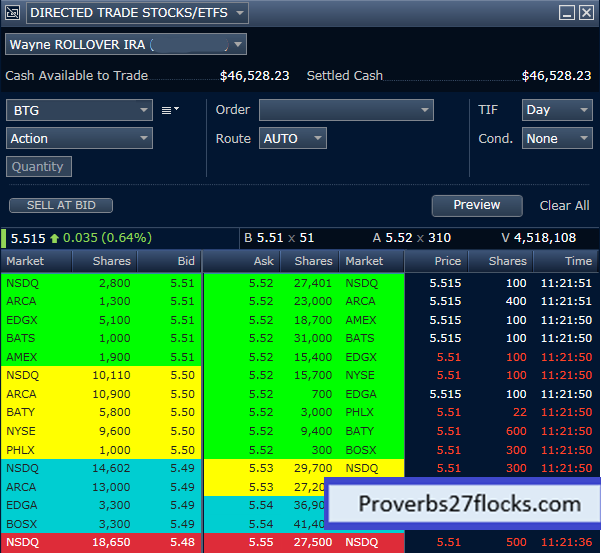
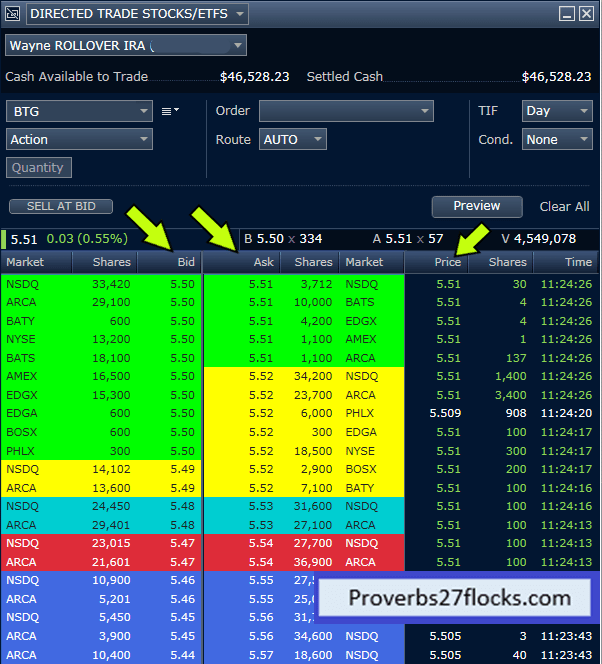
- Review the trading activity for the shares. What are the buyers bidding? What are the sellers asking for their shares? Is the volume heavy with high demand?
- Enter a preliminary order. In this case I chose $5.52 per share.
- Revised my order to $5.51, deciding an extra penny wasn’t worth the trouble.
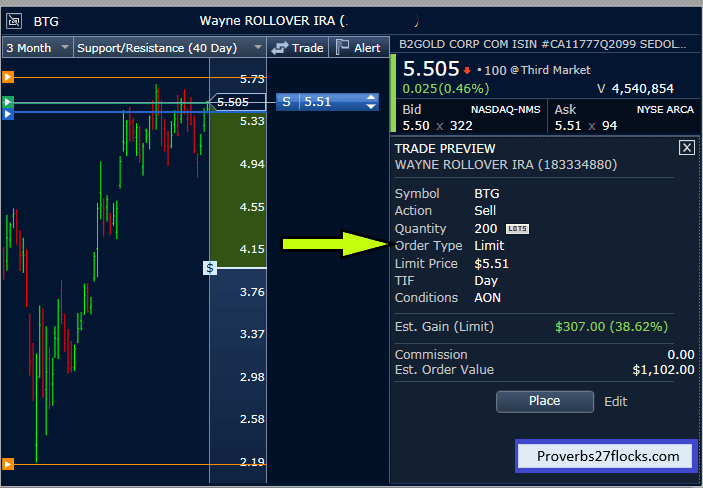
- Preview the order.
- Submit the order.
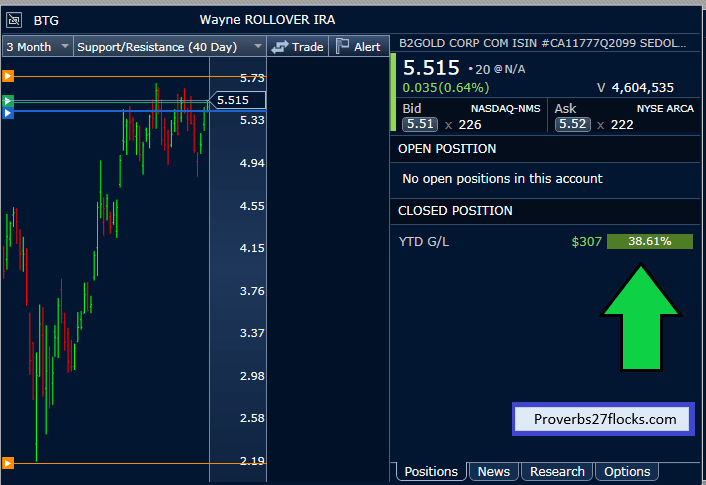
- Collect the profit of 38.61% after owning the shares for three months.
Active Trader Pro (ATP) Images
I recommend Fidelity’s ATP as a wonderful way to enter trades and monitor my positions.


I discourage novice investors from entering short-term trades. Learn how to buy good investments you plan to hold. Don’t become a day-trader!
