Stock Correlation Calculator
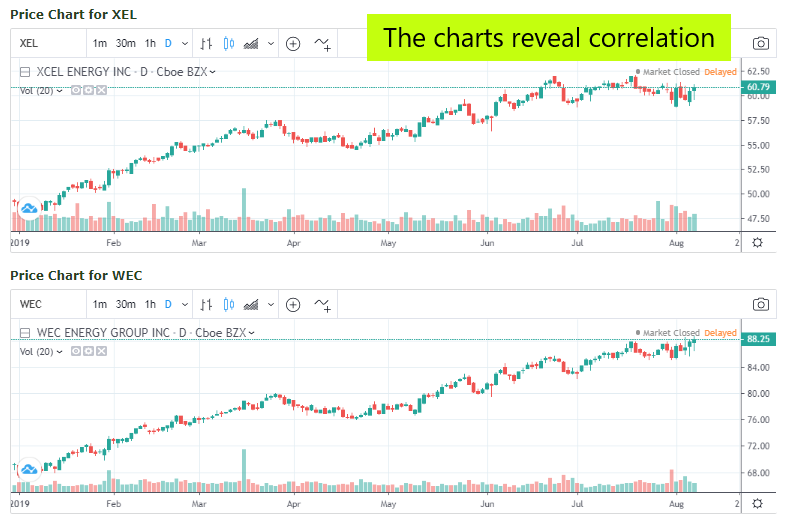
One of the reasons my portfolio behaves differently from the S&P 500 or the NASDAQ or the DOW, is that I have investments that behave differently in the market. For example, a utility stock will often increase in value when the market takes a steep dive. Most utility stocks will follow a similar path, and they tend to be less volatile compared to technology, energy or banking sector stocks.
A stock correlation calculator can help you compare the histories of two different stock investments. For example, I own shares of several utilities. Two of them are WEC and XEL. The BuyUpside website (https://www.buyupside.com/calculators/stockcorrelationinput.php) has a stock correlation calculator.
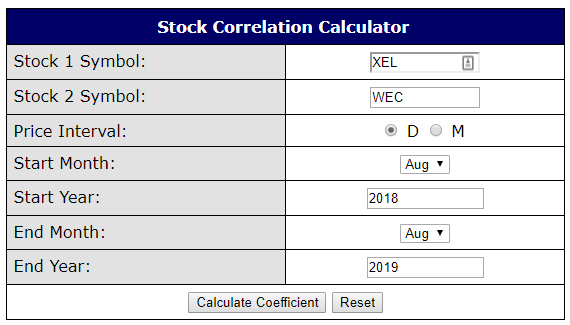
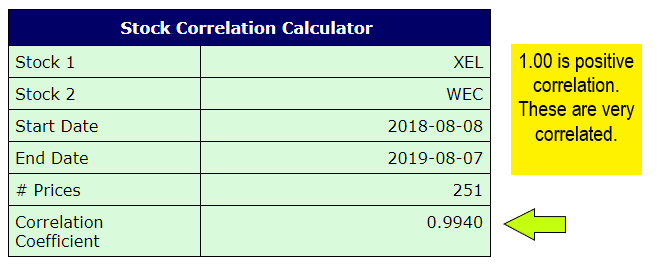
Simply enter any two stock symbols and select the price series (daily or monthly) and date information. Then click on the Calculate Correlation button and the correlation coefficient will be displayed on a new page. The value of a correlation coefficient is between -1 and 1, where 0 represents no correlation between the two symbols, 1 represents perfect positive correlation (prices for both symbols move in the same direction) and -1 represents a perfect negative correlation (prices for both symbols move in opposite directions).
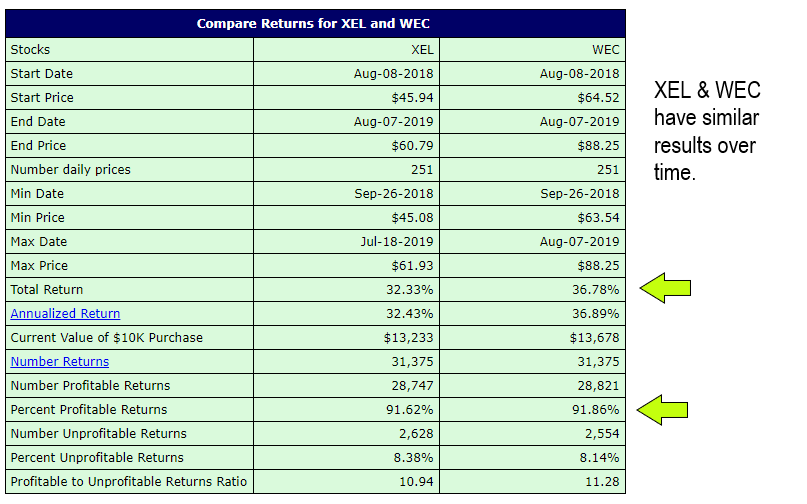
You can learn a lot about your investments (stocks only, not ETFs and mutual funds) by using this tool. Also, if you already own an investment and are thinking of buying another investment in the same sector or a different sector, you might want to compare the new investment with your existing investment to see if they are likely to be correlated or not. I prefer a mix of investments that behave differently to soften the up-and-down volatility in my portfolio.