
One of the great tools on the Fidelity Investments web site is in the ETF section. If you are reviewing an ETF like SCHD, and want to see how it compares with other ETFs like VYM, ITOT, VOO and FDVV, here are the steps you can do:
Log onto Fidelity Investments and select “News & Research” at the top center of the page and then “ETFs”
In the “Enter name or symbol” box enter the ETF. In this case, I used SCHD.
In the drop-down box below the symbol, select “Compare” and then click GO.
You will see, as the default, the Basic Facts & Performance view. You can change this. The view I created above is my CUSTOM view. The reason is that I wanted to see the “number of basket holdings” and the “dividend yield” in my view.
You can now click on “Show similar ETPs” to get Fidelity’s suggested comparison ETFs, or you can individually enter the tickers you want to review. I entered VYM, ITOT, VOO and FDVV in my example.
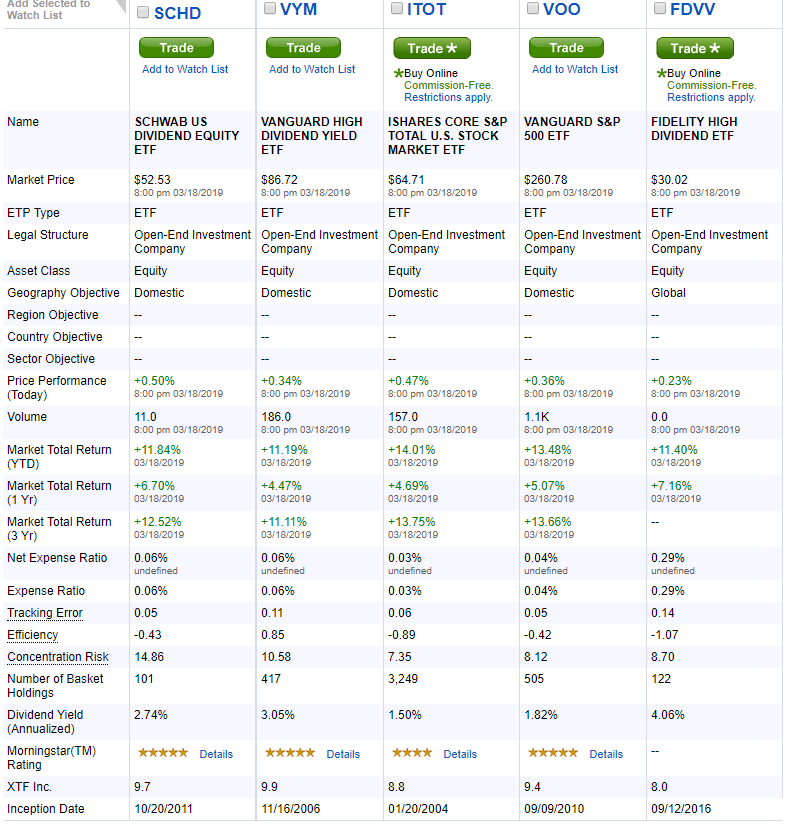
Why is this so helpful? There are three things I always want to know about an ETF. 1) The current dividend yield; 2) the current expense ratio; 3) the number of holdings in each ETF. As you can see ITOT has far more diversification than SCHD. More diversification isn’t always better.
If you look at these you might be inclined to think that FDVV is the best one if you only compare the dividend yield. Don’t neglect the expense ratio in your comparisons.
LINK: ETF Webinar: https://www.fidelity.com/learning-center/investment-products/etf/putting-etfs-to-work-recorded-webinar
If you have a Fidelity Investments account, you can also find valuable information at this web page: https://screener.fidelity.com/ftgw/etf/evaluator/goto/landing
