

New Functionality
Fidelity said this in today’s post in the Fidelity Investor Community: “We just dropped some new performance page features on Fidelity.com that we want to share today.” I went to explore the features. The reason is simple. If I use the default “all accounts” our results are “contaminated” with data from the UTMA accounts, Cindie’s brother’s account, and a couple of accounts I oversee for a friend. I want to see just the true “Winquist” data. Furthermore, I can now separate Cindie’s accounts to see them separate from mine if I want to evaluate the results of her investments.
Here are the three enhancements: 1) Choose your own time frame; 2) Create custom groups; and 3) Add external accounts. I used both ‘1’ and ‘2’ this morning. The following are the three taken from the announcement.
1. Choose your own time frame
You can now view your account(s)’ time-weighted performance within a custom time period. Here’s how: scroll down to the “Total Returns” card, select “See All,” choose “Custom” under “Frequency,” then enter the start and end dates. These dates also apply to the indexes you have displayed on the page for comparison.
2. Create custom groups
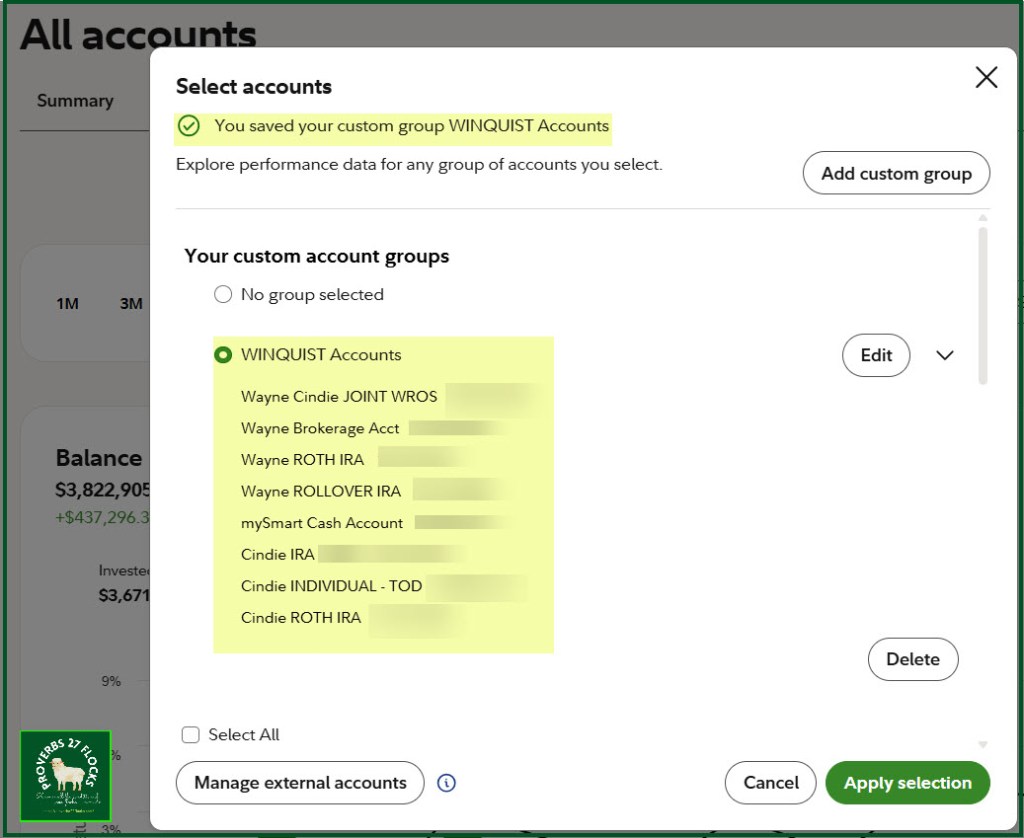
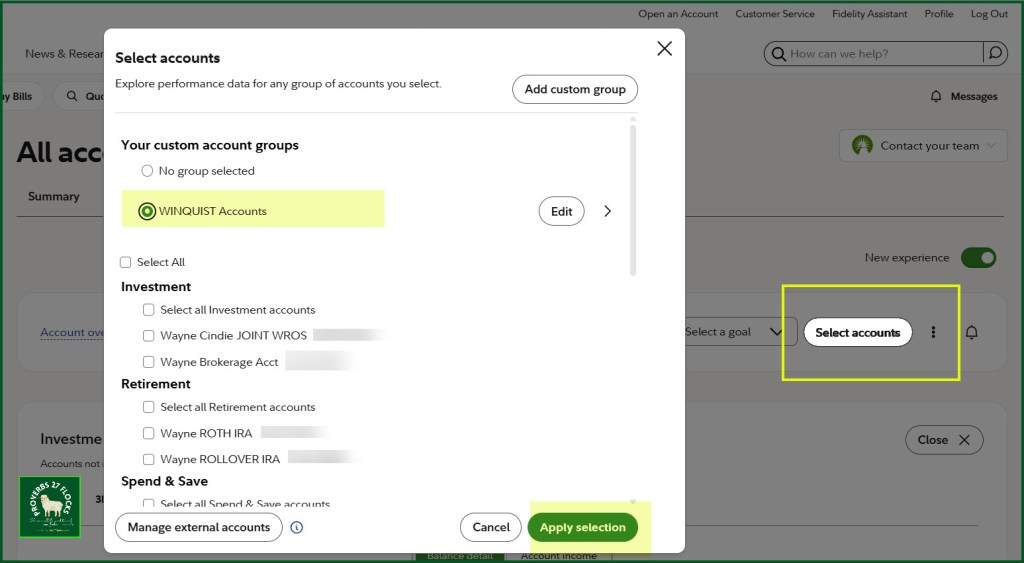
Want to see only how your retirement accounts are doing? You can now group your accounts to view their combined performance. Your custom groups will be saved so you can easily check back on them in the future. To create a group, choose “Select accounts” at the top of the page, then “Add custom group.” If you had created any groups in the legacy experience, those will be carried over.
3. Add external accounts
You can add external accounts to see your overall exposure to different asset classes and investment styles. After selecting “Manage external accounts,” choose a custom asset allocation or enter individual positions for them.
Investment Income
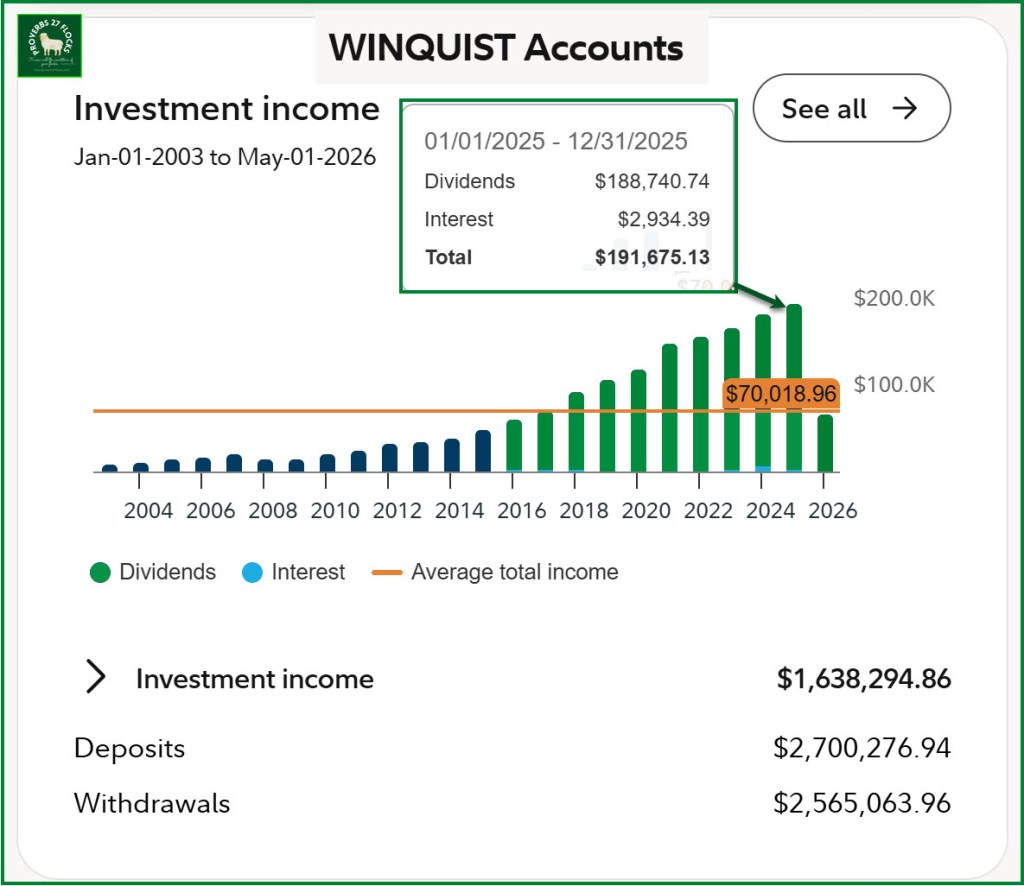
One of the things I want to see is growing income from our investments. I call that type of income “Easy Income” because it requires no effort. The following graph is from the performance page showing only the income for the eight “Winquist” accounts at Fidelity. The average income of $70K has little value, but the upward climb of dividend income is of importance.
Setting It Up
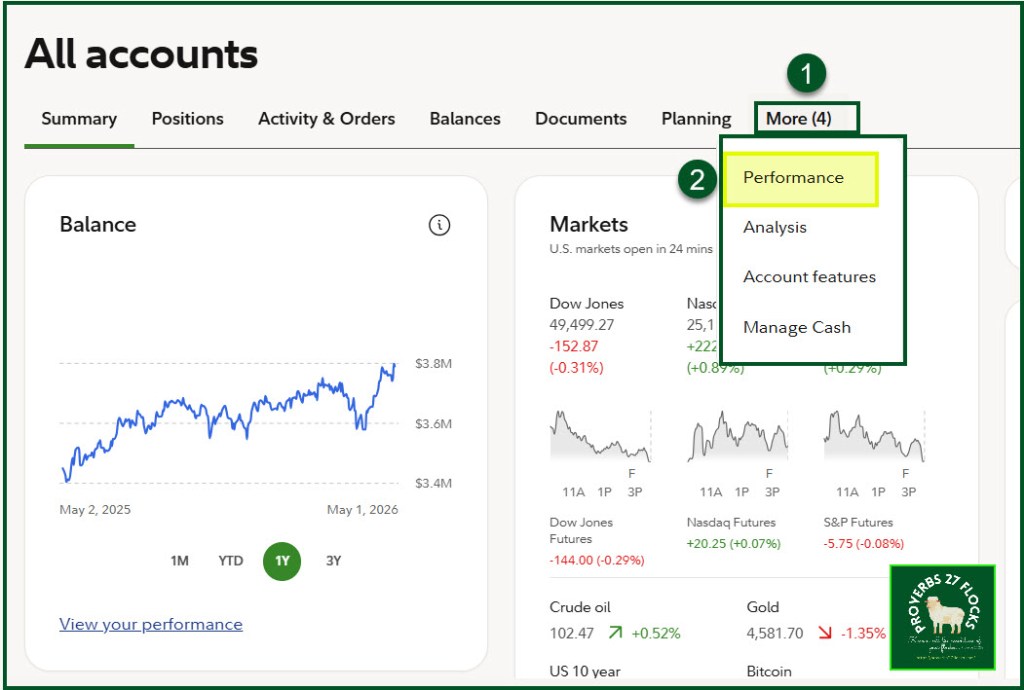
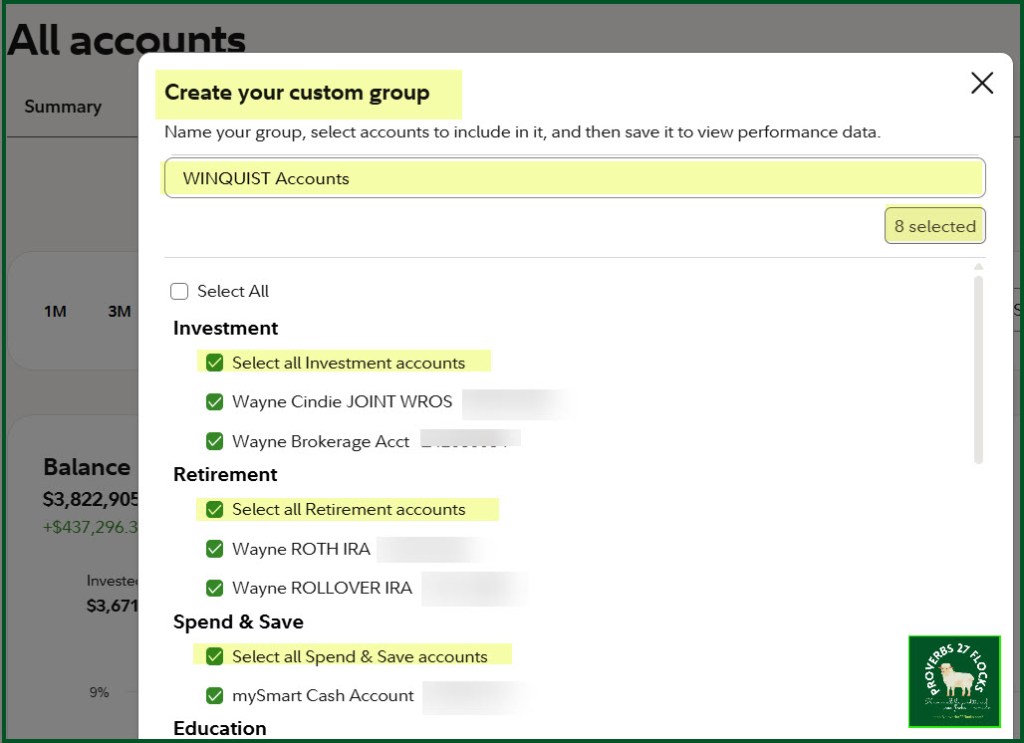
The following images show how I created and used the “Winquist Accounts” group.
Recommendations
If you don’t measure performance then you are overlooking opportunities to either adjust your investments or to just stay on the quality investment course and not think about the market’s ups and downs. It is best to just let good investments continue to perform over your investing life. Rebalancing is generally not a very good idea. That is one reason I abhor “Target Date” mutual Funds or “Retirement Date” funds.
Seeking Alpha Subscription Information
Of all of the resources I use, the most helpful is Seeking Alpha. The Seeking Alpha QUANT rating is a huge factor in my investment success. If you decide to explore a Seeking Alpha subscription, please use the following link. Seeking Alpha

SEEKING ALPHA INFORMATION AND SUBSCRIPTION
You can also scan this QR Code to get the same information.

Past performance does not guarantee future results, Seeking Alpha does not provide personalized advice, and it is not a registered investment adviser.
We accept advertising compensation from companies that appear on our site. This website represents my opinions, which may not reflect those of Seeking Alpha, and does not constitute an investment recommendation or advice.
If you have any questions or problems getting connected to Seeking Alpha, reach out to them with this email address: subscriptions@seekingalpha.com
