

Questions for Investment Buys and Options Trading

There are only a few questions I ask before I buy an investment. These same questions apply for covered call options and cash covered put options trades. Although this will focus on options trades, think about how each of these applies to any investment you want to purchase.
Early Retirement Website
Fidelity Investments made some really bad “improvements” to their Fidelity Investor Community website. Many community members are leaving, and some have gone to a better site for investment knowledge and sharing, I moved on as well. The site I am now using is: EARLY RETIREMENT
You can find me on that site. I recommend it as a resource for those who are interested in learning from others.
On one of my recent posts on “Early Retirement” I talked about the income-producing options trades I have done to generate significant income. One reader said this: “I think you got everyone off their duff like Dick said. Would you say your Options Trading series on your site is up to date on what method you are still using? I see the first post is from December 2022. Or do you have anything to add to it that you have learned over the past 2+ years?”
My Response Was This
I doubt that there is any single post that gives a complete picture of the way I do options trades. I have been thinking about an updated summary post to describe my logic and the data points I consider when doing a covered call or cash covered put. There are some key elements in a post I did in January where I discussed “My Blueprint or Roadmap”, but even that is just a snapshot.
- The main thing I have learned is that you don’t have to live or die by your original contract. One of the ways I have increased my options income is by rolling the contract to later or earlier dates based on market behaviors. If the market is down, and the option expires in September, I’m willing to buy back the original option and sell a replacement covered call for a lower price and a more current expiration date. On the flipside, if the market is moving up, I can buy back the original contract and sell a new one with a higher contract price and longer expiration date.
- So far this is working. I have had 696 contracts expire in 2025 and none of my shares have been sold.
- The other thing that I strive for is simplicity. I don’t want to spend my life looking at every possible data point.
- Finally, I want consistency in the simplicity. By that I mean I will always consider seven data points before making a trade. I will discuss those seven pieces in this post. However, first some background about the illustrations and Fidelity’s Active Trader Pro “Trade Armor” tool.
Ownership of STX (Seagate Technology Holdings)
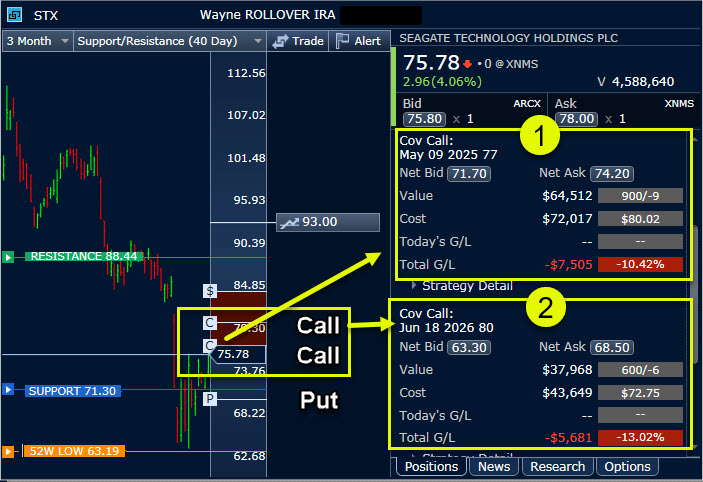
I currently own 100 shares of STX in my ROTH IRA and another 1,500 shares in my traditional IRA. All of these shares have covered call contracts with various expiration dates and share prices. For example, in my traditional IRA I have nine contracts (900 shares) that expire on May 9, 2025 with a price of $77. There are another six contracts (600 shares) that expire June 18, 2026 at $80 per share. Therefore, all of my shares have open covered call contracts.
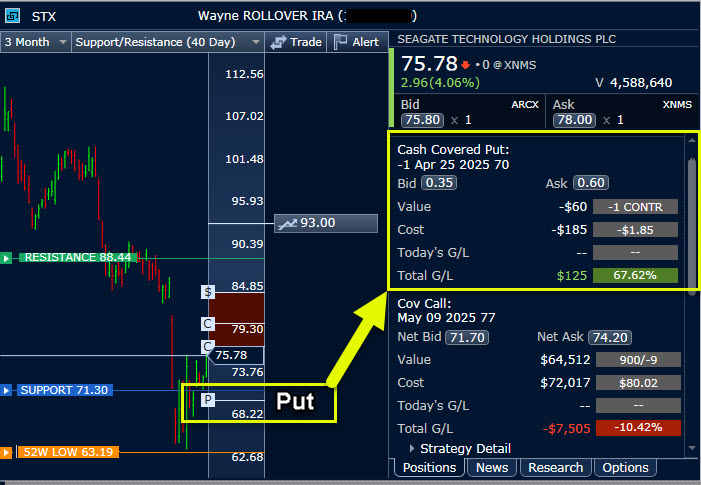
In addition, I have one cash covered put option contract in my traditional IRA that has a contract price of $70 and an expiration date of April 25, 2025. If the price of STX shares drops to $70 or lower, I have to buy 100 shares of STX for a total cost of $7,100 ($70 x 100 shares.)
Active Trader Pro (ATP) and Share Price Markers
If you use ATP for options trading (or just for buying and selling shares) you can easily see some markers on the “Trade Armor” window. The 52-week high/low price lines are orange. The “resistance” line is green, and the “support” line is blue. While not a key element in my options trading strategy, it is helpful to see what is likely to happen with share prices for an investment, especially in the short-term.
Resistance: “A resistance level represents a price point or price zone that an asset has had trouble breaking above in the time period being considered.” Investopedia I find this a bit helpful, as I like to keep my covered call options contract price above the resistance level. This is not an unbendable rule, but it is a consideration.
Support: “Support occurs at the point where a downtrend is expected to pause due to a concentration of demand.” Investopedia (This is a fancy way of saying it appears unlikely that the share price would easily drop below the “support” price. New buyers are often attracted by lower share prices, increasing the demand for the shares. This often causes the share price to go up. This value is helpful when entering cash covered put options.
52-Week High or Low: This is only of value if the shares tend to trade within these values. If extremely good news arrives, the share price can bounce much higher, creating a new “52-Week High.” If some really bad news appears, then the “52-Week Low” can go much lower. Because most of my options trades are not going to be 52 weeks long, these are just historical numbers, not terribly informative when entering options trades.
An Options Contract Example Using Verizon Communications
Using my view of VZ (Verizon Communications) we can see all three lines in relationship to my current covered call option contract. The contract price is $45, and the contract expiration date is quite a bit into the future: December 18, 2026. This is not a recommendation for the expiration dates that I consider normal for most options trades. The reason is simple. This expiration date means the contract will be open another 607 days before it expires. It is better to stick to expiration dates of less than 30 days. In fact, for stocks that have weekly options it is better to stick with expiration dates that are only one week away.
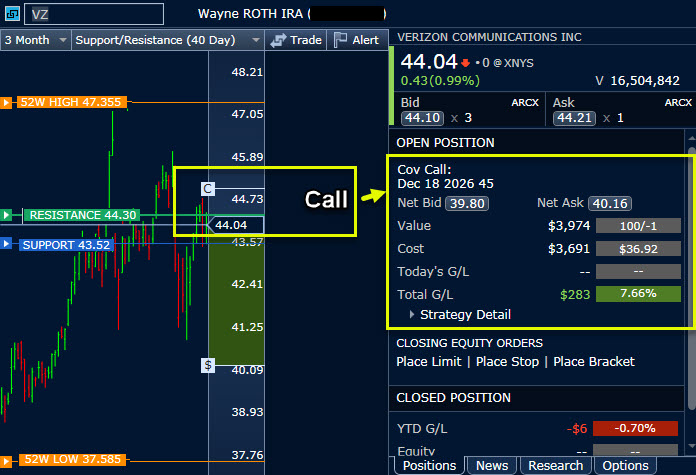
Even so, consider the following about this type of contract. First of all, if the price per share drops, I can usually roll the contract to a lower price with an expiration date that is closer to today. I will only do this if it generates additional income. Secondly, the entire time the contract is open I receive the quarterly dividend. Because the VZ dividend is $0.6775 per share, I will receive quarterly dividends of $67.75 each quarter until December 18, 2026. Finally, even if the shares are called away at $45/share, I will have a profit of $481 (The contract price of $45 less my cost basis of $40.19 times 100 shares.)
Some will argue, rightly, that I will lose money (in a sense) if the shares rise to $50. What they mean is that I give up an additional $500 in profit that I could have made if I did not have to sell my shares at $45. However, by rolling out contracts I have found that the risk of losing my shares at a much higher price is greatly reduced. This assumes that I want to keep the shares. In general I don’t want to roll the contract out into the future if I think the investment is of questionable quality and value.
Seven Questions in Five Minutes
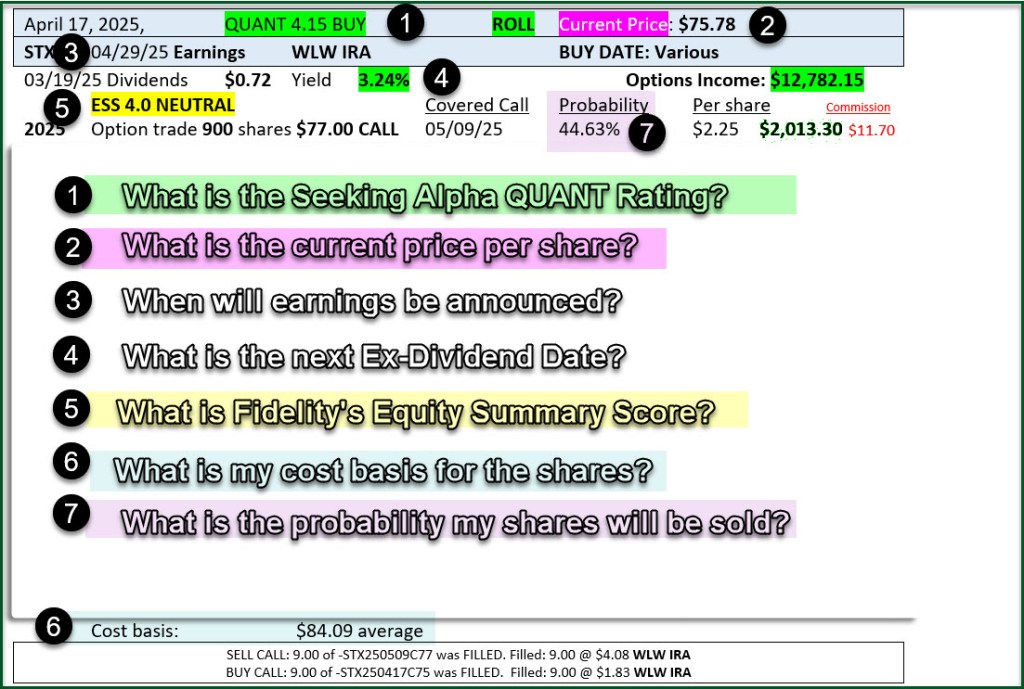
I can get six of the questions answered within ATP’s Trade Armor. The questions are shown in the following illustration. I use my paid subscription to go to Seeking Alpha’s website to see the current QUANT rating for the shares. Generally speaking I only want to have or buy investments that have QUANT ratings of 3.00 or better. This means that the rating is going to be a “HOLD” or, if 3.00 or greater a “BUY” or, if 4.00 or greater a “STRONG BUY.”
The 1) QUANT rating helps me know how tenaciously I should protect my holdings from being called away. If the shares are a “BUY” or “STRONG BUY” I want to keep the probability that my shares will be called lower. This means I don’t get overly aggressive with the contract price. I want to keep the covered call contract price high and the duration of the contract short. If the QUANT rating is 3.50 or better, I am more willing to buy shares. Currently STX’s QUANT rating is 4.34. That means it is a “BUY.” (The screen image show it was 4.15, so the rating moved up.)
2) Current Price: STX’s current price per share is $75.78. This, plus the 3-month price trend (shown in the Trade Armor graph) helps me judge where the price might be in the next week. It takes less than 5 seconds to see this number.
3) Earnings Date: The reason this is important is that good earnings reports can significantly increase the price of the shares and a less than gangbusters report can result in the share price dropping significantly. As a general rule I want my contracts to expire before the earnings are announced.
4) Ex-Dividend Date: I don’t want to gain options income at the expense of losing my dividends if the stock pays a dividend. Because the last announced dividend is in the past (03/19/25), I already can count on receiving the next dividend for my 1,500 shares of STX. If the Ex-Dividend date is a week or two in the future, I want to set a contract price that makes losing my shares less painful. I either want the option trade income now, or I want the dividend plus the option trade income later. Usually I want both.
5) Fidelity’s ESS: This number is secondary to the QUANT rating, but it is a helpful indicator of investor sentiment. Sometimes this value aligns with the QUANT rating and other times it does not. If both the ESS and the QUANT rating are bullish, then I want to be conservative with my contract price and the contract expiration date.
6) Cost Basis: My average cost basis for the STX shares in my traditional IRA is $84.09. If my contract price is less than this I will have a loss if my shares are called. However, the loss is often mitigated by the option income I have already received. It takes less than 5 seconds to see this number. The goal for 95% of my options contracts is to have a gain if my shares are called. STX is a rare exception to this rule.
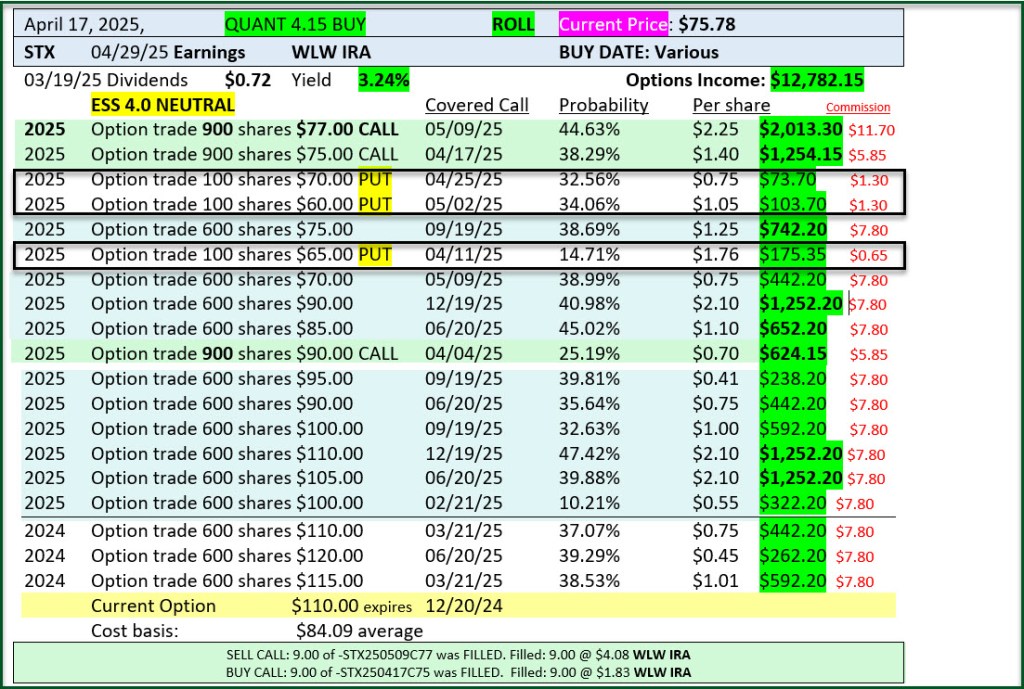
7) Probability: Over time I have tried to keep the probability value between 20-35%. This is easily achieved by increasing the share price for the contract or reducing the duration of the contract. This value is seen in the Options tab in the Trade Armor window. When I roll a contract, like my STX covered call options, I am willing to see higher probabilities. If you look at my options trades for 2025 you will see probabilities that range from 10% to 47%. If the probability is 10% my risk of losing my shares is low. If it is 47%, it says my risk is now about 50/50. Heads I win, tails I lose.
This image shows an open cash covered PUT option for STX shares. This contract expires at the end of the current week.
The next image shows fifteen options contracts. One is a group of nine contracts (900 shares) that expires in May 2025. The other is a group of six contracts (600 shares) that expires in June 2026.
Strive for Weekly Options
Some stocks only trade options contracts that expire monthly on the third Friday of the month. For example, MAIN only trades monthly options and even those are sparse. Healthcare stocks like ABBV, BMY, CLOV, PFE, and MRK have weekly options, as do IT stocks like HPQ, IBM, TSM, and PLTR. Some stocks and ETFs don’t have an options contracts. I often suggest Ford (F) as a good place to learn options trading, as the cost per share is low so the total risk is lower.
My most profitable options contracts are for a few select stocks, including ABBV, AVGO, IBM, JNJ, NVDA, and HPQ.
The Income Twosome
In the end my primary focus will continue to be dividend growth stocks and ETFs. This is a reliable and simple way to get income. However, as I have followed the template above in 2025 I have received $94,068 in options income through last week. That is $23.5K per month or $6,271 per week. Our dividend income is significant, but it is nowhere near those numbers.
Here are my 2025 STX Options Trades
Three of them are related to the open PUT contract.
Other Considerations for Dividend Investors
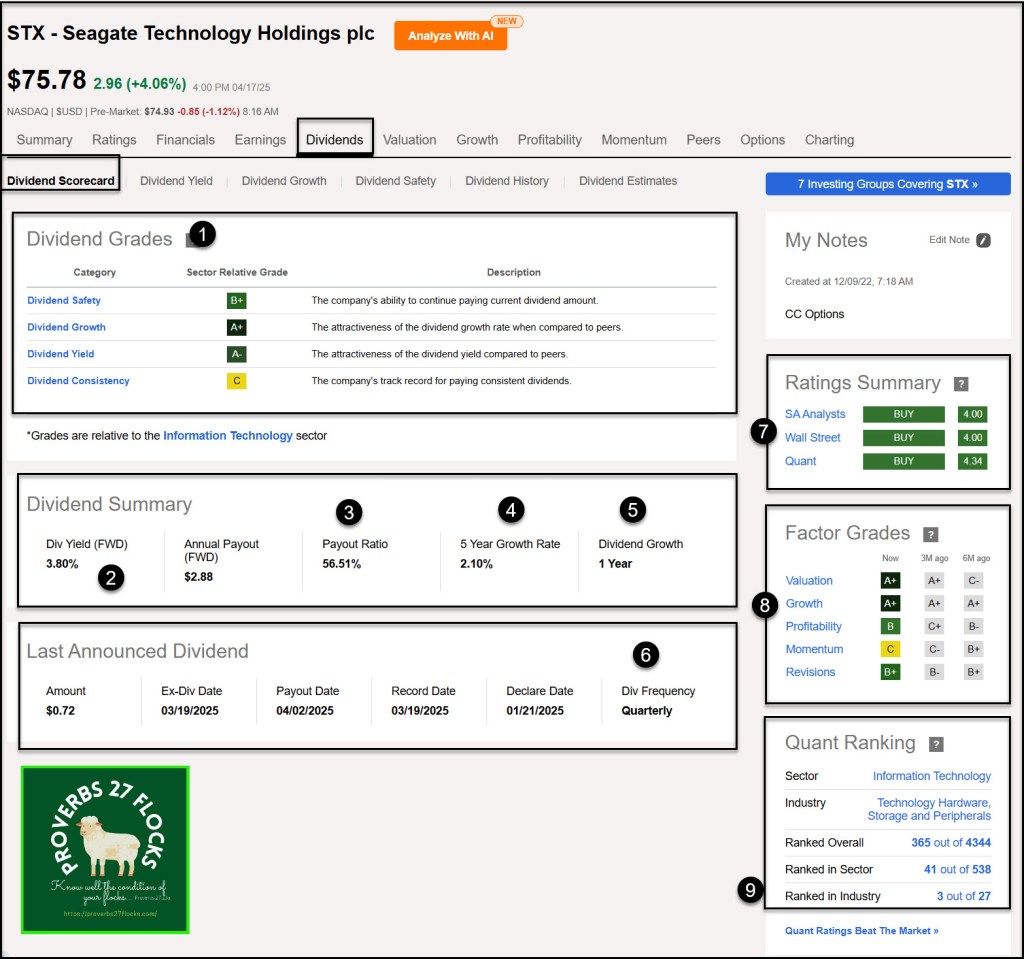
There are some other things to consider when buying an investment. If you are focused on dividend investments and dividend growth investments, then you want to know some things about the dividend payments. These include the dividend yield, the dividend payout ratio, the 5-year dividend growth rate, and the number of years the company or ETF has increased their dividend.
Take the time to use Seeking Alpha’s QUANT rating ranked by industry. That is shown as number nine in the following STX illustration.
If you would like a PDF of the information included in this post, click on this link: Instructions PDF
Seeking Alpha Subscription Information

Of all of the resources I use, the most helpful is Seeking Alpha. If you decide to explore a Seeking Alpha subscription, please use the following link. Seeking Alpha
SEEKING ALPHA INFORMATION AND SUBSCRIPTION
You can also scan this QR Code to get the same information.

Past performance does not guarantee future results, Seeking Alpha does not provide personalized advice, and it is not a registered investment adviser.
We accept advertising compensation from companies that appear on our site. This website represents my opinions, which may not reflect those of Seeking Alpha, and does not constitute an investment recommendation or advice.

Incredible information. I would like to dip my toe in options trading, but many times it feels overwhelming.
LikeLiked by 1 person
It may seem daunting at first, but if it was too difficult then the people I have taught wouldn’t be trading options. It is quite easy using Fidelity’s Active Trader Pro software. Anyone can use that software.
LikeLiked by 1 person