
Creating 55 Gallon Aquarium Stands

We recently repainted the basement recreation room and put in new flooring to replace the dated carpeting. Then I started a new project to add two 55-gallon aquariums to that area. The least expensive way to create aquarium stands is to buy used kitchen wall cabinets, sand them, and paint them black with cabinet paint. To create the tops I will be joining some boards I have in my basement workshop using biscuits.


I have the biscuits, but unfortunately I no longer have the tool that creates the slots for the biscuits. I discovered that I could purchase some router bits on Amazon (I have a router) that will do the job. Having the right tool makes it easy to do work that would otherwise take more time. It also helps make the finished product look like it was done well.


The same is true in all aspects of life. Whether you are working in the kitchen, in the garden, or on the family vehicle, the right tool can make all the difference. This is also true in the world of investing. Surprisingly few people know about the tools that Fidelity offers for the prudent investor. We will look at one of them today.
Fidelity Positions – Four Flavors
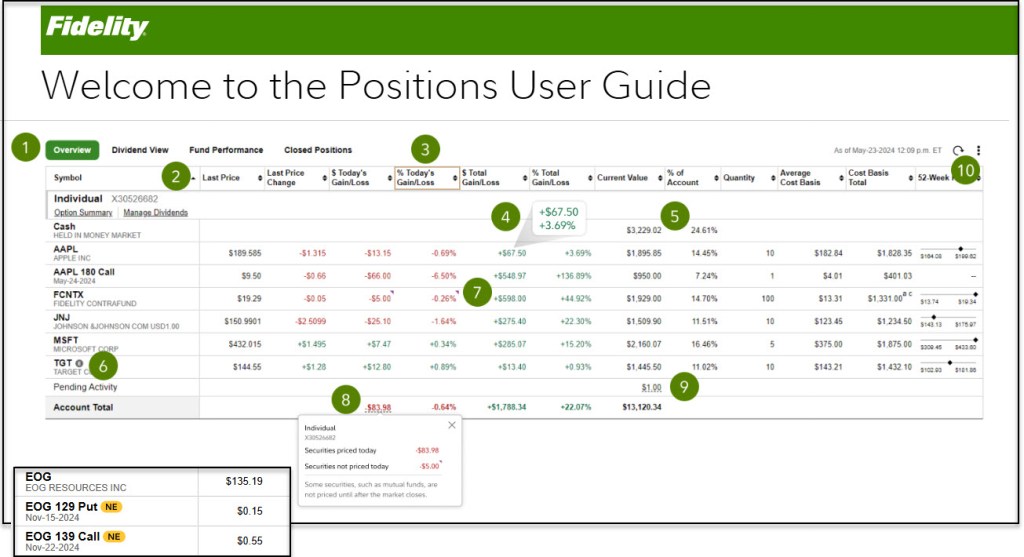
If your IRA and brokerage accounts (or 401(k) accounts) are with Fidelity, then you can learn a lot about your investments on the Fidelity “POSITIONS” page. There are four choices. Each has a unique view of some important information. The four views are “OVERVIEW”, “DIVIDEND VIEW”, “FUND PERFORMANCE”, and “CLOSED POSITIONS.”
When you are using the main Fidelity “POSITIONS” page, there is a wealth of information available. You can look at the default view. This view is known as the “OVERVIEW” and it includes your total gain/loss, the percent this position is in the account, your average cost basis, and the 52-week price range. There are totals at the end of each account and a total of all accounts visible to you. This is helpful, as I also manage my wife’s accounts.
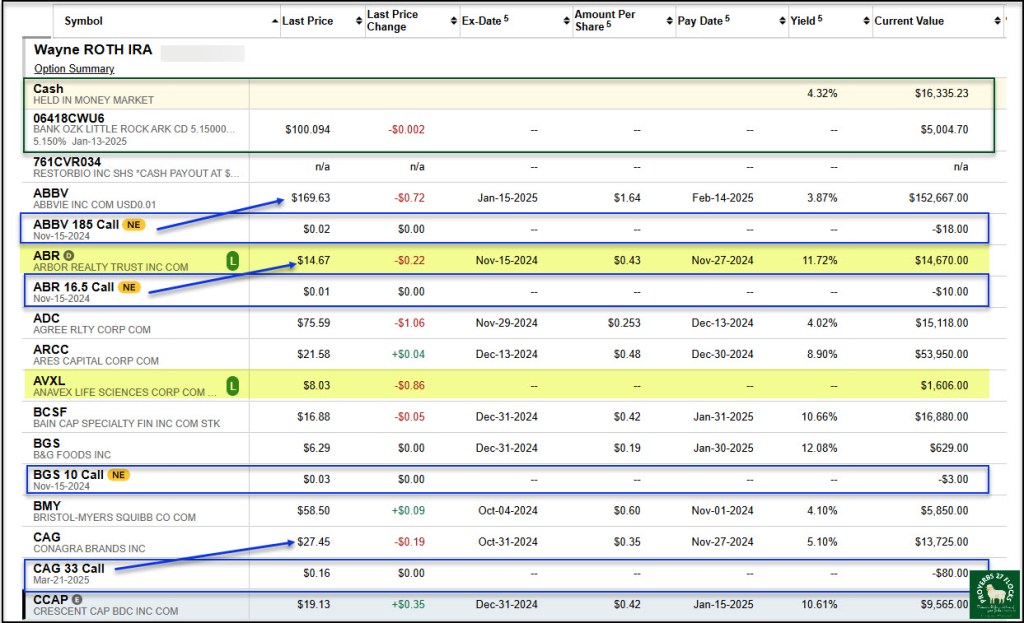
You can change from OVERVIEW to “DIVIDEND VIEW.” This view will give you your estimated annual income (EAI) and some vital pieces of information about each position’s dividend (if a dividend is paid) including the Ex-Dividend Date, Pay Date, Yield, and the EAI. Again, if you have multiple accounts, there will be a subtotal for each account. If you have all of your accounts selected, the total EAI for all accounts will be displayed at the bottom of the table. So, for example, our eight Fidelity accounts are expected to deliver $163,541.75 in dividends during the next rolling twelve months.
The third view is “FUND PERFORMANCE.” This is a helpful way to see the expense ratio and the one, three, five, and ten year returns for your ETF, Money Market, and mutual fund investments.
The last view is the “CLOSED POSITIONS” view. This shows the Short-term Gain/Loss, Long-term Gain/Loss, and the Total Gain/Loss for sold positions. If the account is taxable, knowing about your ST and LT gains and losses can help you plan for income taxes.
How to monitor your positions.
1. Change views. Click between Overview, Dividend View, Fund Performance, and Closed Positions.
2. Sort data. Arrange column data in ascending or descending order to enhance your analysis. Fidelity stores this setting for next time you use the tool.
3. Move columns. Arrange columns by clicking, then dragging the column header left or right. Again, Fidelity stores this setting for next time.
4. Stacked view. On a narrow screen, some positions data is stacked to save space.
5. Cash position. Your core cash position shows only the most relevant fields.
6. Impact event. Check for events impacting your position when you see an icon next to the symbol. This includes things like earnings, distributions, and options nearing expiration.
7. Price indicator. The purple arrow mark indicates when pricing is not from the current day.
8. Today’s gain/loss. View today’s and prior days’ impact from your current positions.
9. Pending activity. View pending debit/credit details in your account.
10. Setting menu. Select Settings to change how your positions are displayed.
Impact Events Indicators
There are a few indicators worthy of note for stocks you have in the lending program, options that are nearing expiration, an earnings indicator, and a dividend or capital gains distribution. They appear as follows.
L = Position is on loan in the Fully Paid Lending Program
NE = Nearing Expiration (an options contract is nearing the contract expiration date)
E = Earnings Indicator Icon – Indicates an Earnings event exists within 5 calendar days. Earnings beat or miss is based on the actual earnings compared to the I/B/E/S consensus estimate.
D = Distribution Indicator Icon – Indicates a Dividend or Capital Gains Distribution exists.
Downloading Positions to an Excel Format
Finally, on any of these views you can download the information to a csv file that can be imported in your spreadsheet tool. I highly recommend using this feature if you have more than ten positions.

Good advice. I don’t have fidelity but I can do similar things with Schab.
LikeLiked by 1 person