When the Share Price Persists Upward

Sometimes I trade a covered call option for a price that I think is high enough that the contract will expire at a price lower than my estimate. If the price continues up, and I want to keep the shares, I will consider doing a trade to roll the contract price for the shares up with a date that is out another week or two. This has happened twice with my 600 shares of IBM in the last month.
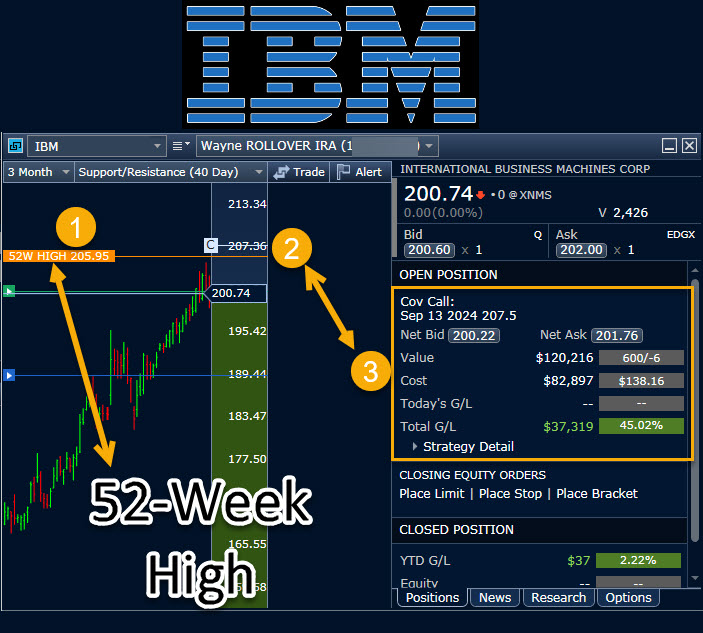
This strategy accomplishes two things. 1) It prevents or delays the sale of my shares at a higher per share price and 2) I earn some additional income. As you can see in the following extract from my traditional IRA, I started with some covered call trades (at $200 per share) in August. These contracts expired and I kept my shares.
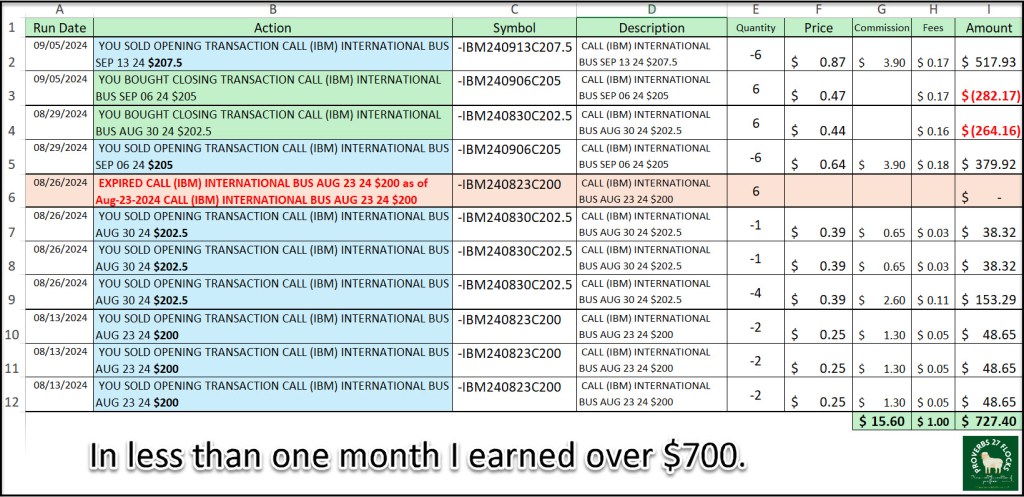
The price of the IBM shares continued the upward trend, so I sold a new covered call option on the 600 shares on August 26 with a contract price of $202.50. This is $2.50 more per share than my original contract price earlier in August.
On August 29 I bought a closing options contract to close the $202.50 contract and sold a new contract at $205 per share. The net of that transaction earned me more income and raised the contract price as IBM’s shares continued their upward climb.
Then, last week on September 5, I bought a closing contract on the $205 contract and sold a new covered call contract for $207.50 that will expire this Friday.
Each of these buy/sell contracts was done with a single ROLL transaction using Fidelity’s Active Trader Pro. Fidelity charged me a total of $16.60 and I kept a total of $727.40 for less than one hour of my time.
Paying Attention
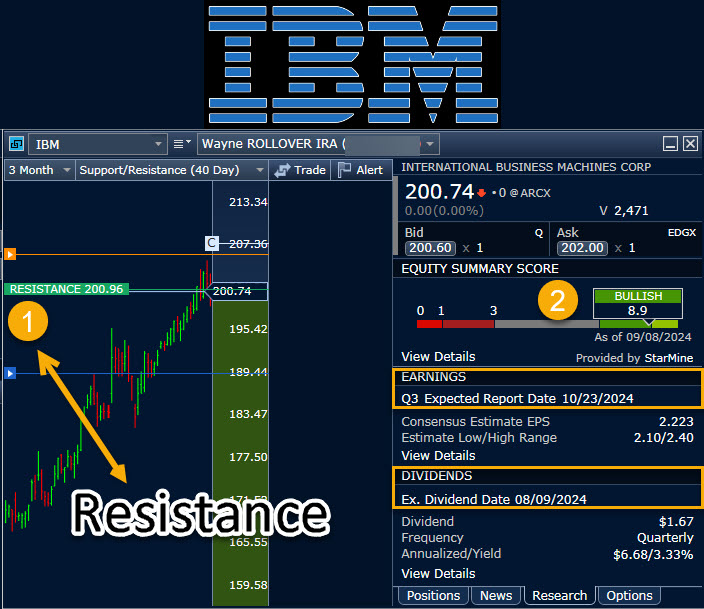
It is wise to pay attention to three markers when you are trading options. One is called the “52-Week High”, the next is called “Support” and the third is called “Resistance.” I will define these using Investopedia and then I will share what I do with this information.
RESISTANCE
“A resistance level represents a price point or price zone that an asset has had trouble breaking above in the time period being considered.” – Investopedia
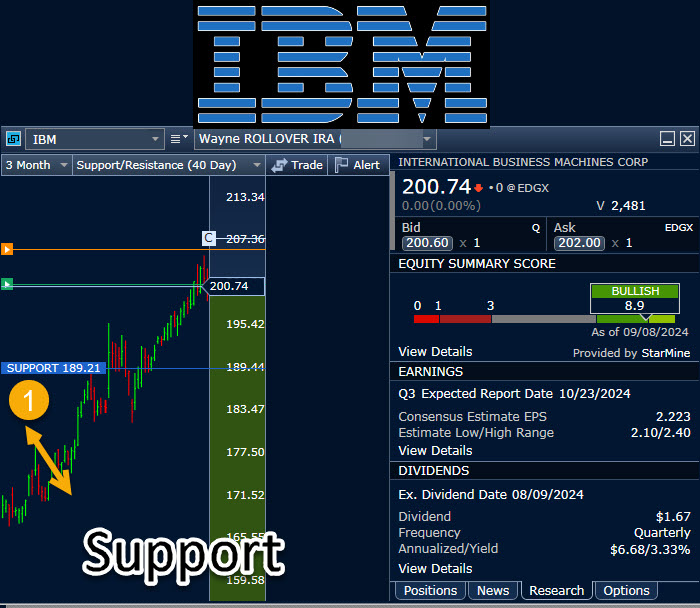
SUPPORT
“Technical analysts use support and resistance levels to identify price points on a chart where the probabilities favor a pause or reversal of a prevailing trend. Support occurs where a downtrend is expected to pause due to a concentration of demand. Resistance occurs where an uptrend is expected to pause temporarily, due to a concentration of supply.” – Investopedia
52-Week High
“The 52-week high/low is the highest and lowest price at which a security has traded during the time period that equates to one year and is viewed as a technical indicator. The 52-week high/low is based on the daily closing price for the security. Typically, the 52-week high represents a resistance level, while the 52-week low is a support level that traders can use to trigger trading decisions.” – Investopedia
Why These Help
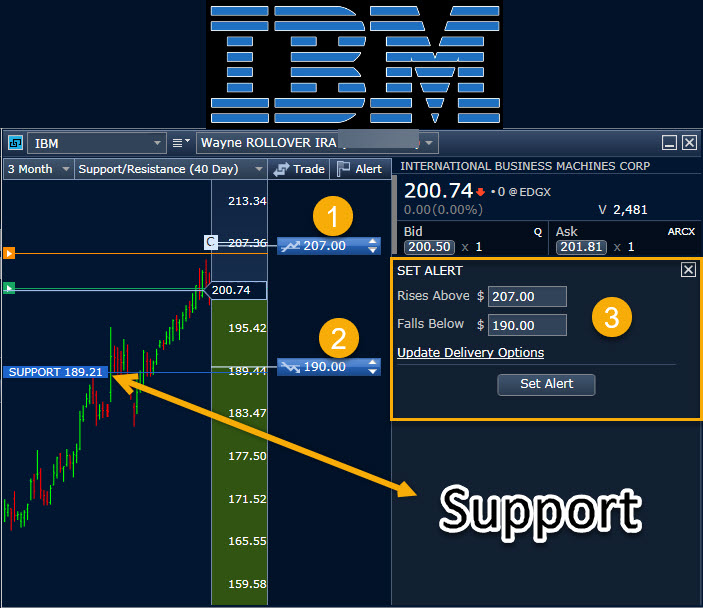
Because I don’t want to sit at my computer trading options for more than 20-30 minutes per day, I set alerts to help me know if something has happened that requires my attention. The following screen shows how I set my price alerts.
Of most importance is knowing if the shares of IBM are likely to go above my covered call option price of $207.50 per share. If I get an alert, I can do another covered call roll up to $210 per share to expire one more week out. Using this technique, I add income and reduce the threat that my shares will be called away.
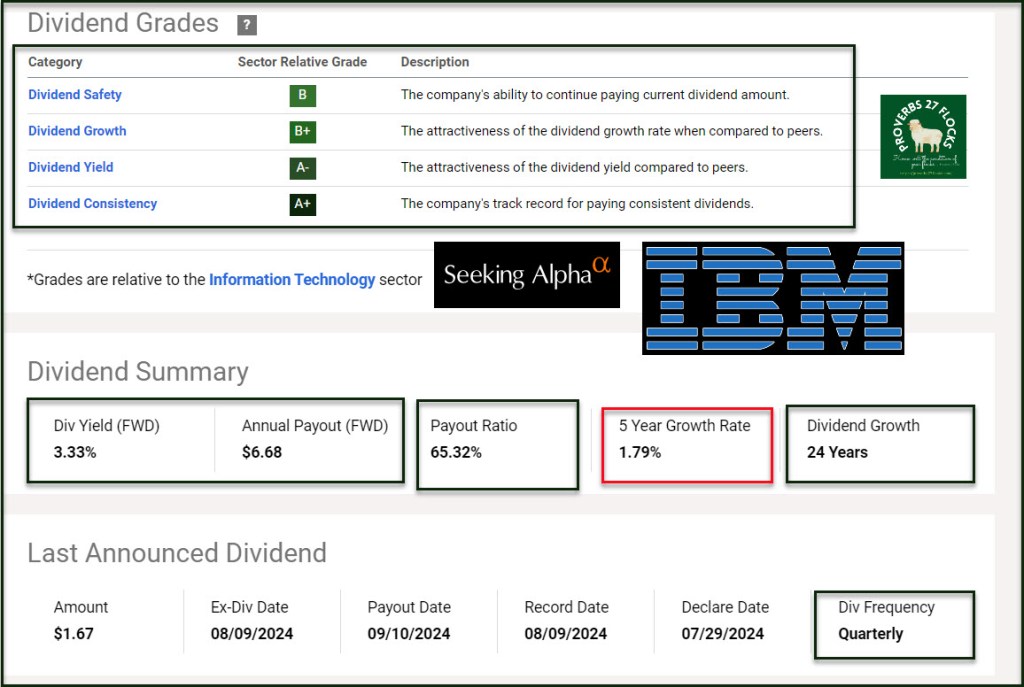
This, I submit to my readers, is very easy income with very little risk of losing my investment. Why do I care? Because I also want to keep getting the IBM dividends.