

What are Two of the Goals?

In January 2024 I set some goals for giving and for dividend income. Our giving has been increasing according to plan. Being able to use Qualified Charitable Distributions (QCD) as a part of the IRA Required Minimum Distributions (RMD) has been a huge factor. Instead of losing 20% of the cash to federal and state income taxes, we are able to give the entire RMD withdrawal from my traditional IRA account.
Because my RMD for 2024 is $73,151.87, I set a goal to give at least that amount to qualified organizations under the tax code. For the first half of 2024 we have given $59,262.90 using the QCD approach. If I had not done it this way, then only about $47K would have been available for giving.
What About the Dividends Goal?
This year I set a lower target for dividend growth. Last year it was 9% and for 2024 I hope to achieve 7%. That should be an easy target. There are reasons I think this. First of all, VYM continues to be our largest holding, and it has a five-year dividend growth rate of 5.81%. SCHD has a five-year dividend growth rate of 12.88%. (Source for the 5-year growth rates is Seeking Alpha.)
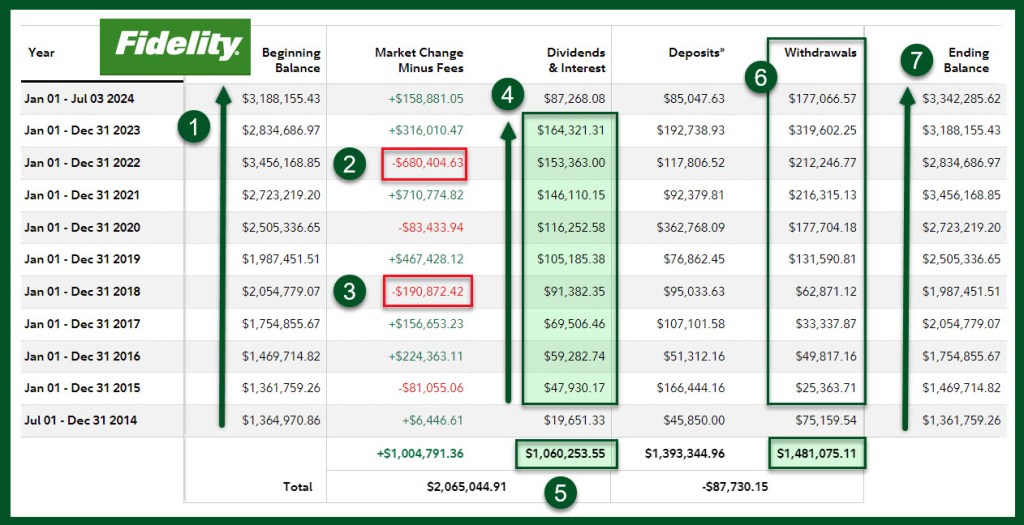
This is a picture from Fidelity of our dividend income from 2015 through the midpoint of 2024. There are key trends to notice in this image. (1) The total balance of our accounts has been increasing, even though we have withdrawn significant dollar amounts from our accounts in these years. I’m a bit skeptical of the “Deposits” column, as I suspect it includes ROTH transfers and conversions from my traditional IRA.

(2-3) Investing can rattle a person’s nerves. You can see that 2018 and 2022 were difficult years. I don’t panic and sell our investments. That is a fool’s errand. A fool loses things because of panic and a lack of a plan.
Notice column (4) to see what has happened with our dividend income over these same years. This continuing increase not only keeps pace with and beats inflation, it provides opportunities for the charitable giving goal. If you multiply the mid-2024 dividend of $87K by two, you should get $174K. That is an increase over last year’s $164K. While it is not guaranteed, that would be about a six percent increase. I expect to end the year with more income because of the recent CD purchases ($80K) I have made that generate additional income. This is easy income.
(5) shows that our total dividend income over this time period is over one million dollars. To look at this another way, the average income for the last ten years has been $100,000 per year. That is easy income.
(6) reveals the withdrawals we have made during this same ten years. As noted earlier, this is somewhat misleading, as I think it has to include ROTH IRA conversions. I need to speak with Fidelity to get a better understanding of these two columns: Deposits and Withdrawals.
Finally, notice the right-most column that shows the December balance for each year. This increase is attributable to both dividends that are increasing, covered call options trades, and the sale of assets that generated profits I could reinvest in other assets like VYM.
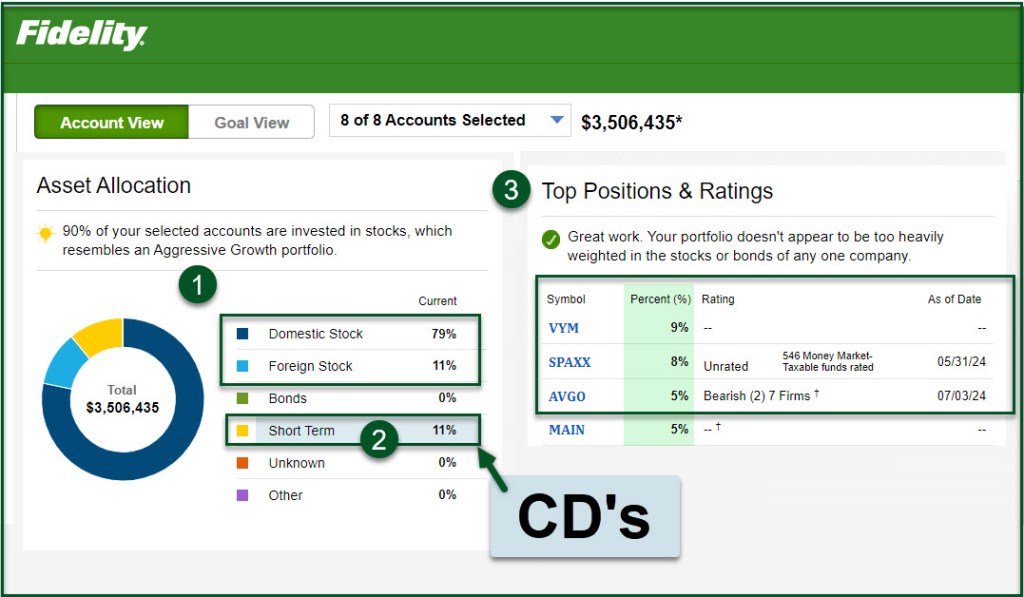
Asset Allocation
VYM continues to be our largest holding. I have reduced my exposure to AVGO. It used to be my second-largest holding. Now SPAXX fills that space along with a heavier allocation to CDs that are yielding over 5% in interest. Most of the interest is paid monthly.
If you have been following me for some time, you will notice that our stock holdings have dropped from 98% to 90%. This is still “very aggressive” according to Fidelity and most financial advisors. However, this is the result of taking profits on positions like AVGO and AMD. I am still considering what investments to buy to replace AVGO and AMD.
In a future post I plan to share our current top ten investments and why they qualify for the top ten.

Wayne, thanks for sharing your journey. Do you have a post about how to generate the reports you post? I’m a Fidelity investor and I’d like to see how my holdings look, but I’m not sure how to create these reports. Thanks!
LikeLiked by 1 person
Hi Pete,
Are you comfortable using Excel? That is the starting point. I don’t have a post that talks about this, but if we did a Zoom call I could share my screen and show you how easy it is to do this. I often download my positions for analysis within Excel.
I also use pivot tables in Excel to summarize data across all eight of our Fidelity accounts. I need to do it this way because we often hold the same position in multiple accounts. For example, we have shares of MAIN in seven of our eight accounts.
One helpful tool on Fidelity is the Watchlist. You can create your own watchlist of positions that you want to compare and it is possible to download that watchless to Excel.
Of course, I also use Seeking Alpha, and that gives me more options for downloading spreadsheets for analysis.
LikeLike