

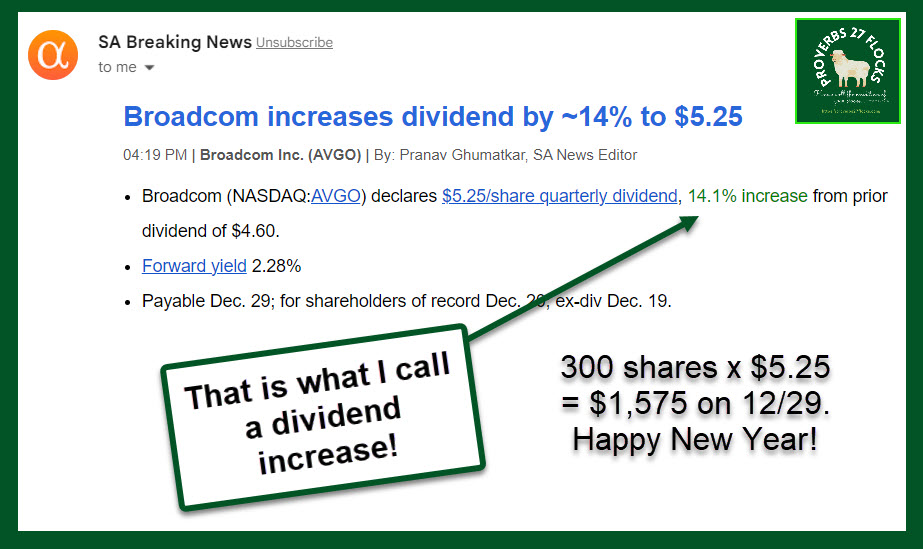
The AVGO Announcement
When I saw the announcement of the dividend increase, I was very pleased. Most dividend increases are usually less than ten percent. To have a company increase their dividend by 14% is a nice addition to the growing value of the shares. Because I have 300 shares in my traditional IRA, I will receive $1,575 in dividends on December 29. That is a great way to wrap up 2023.
Three Views of the Dividend History
Some of my readers don’t have subscriptions to StockRover or Seeking Alpha. However, many, if not most of them are Fidelity Investments’ clients. My least favorite dividend information is available from Fidelity. Both Seeking Alpha and StockRover offer better long-term views.
Fidelity’s chart view is limited to a little less than three years. You may notice, however, that the share price shown by the green line reveals some investor behavior. In the third quarter of last year, investors were nervous about AVGO stock. Then in the second quarter of this year the stock price was bid up considerably.
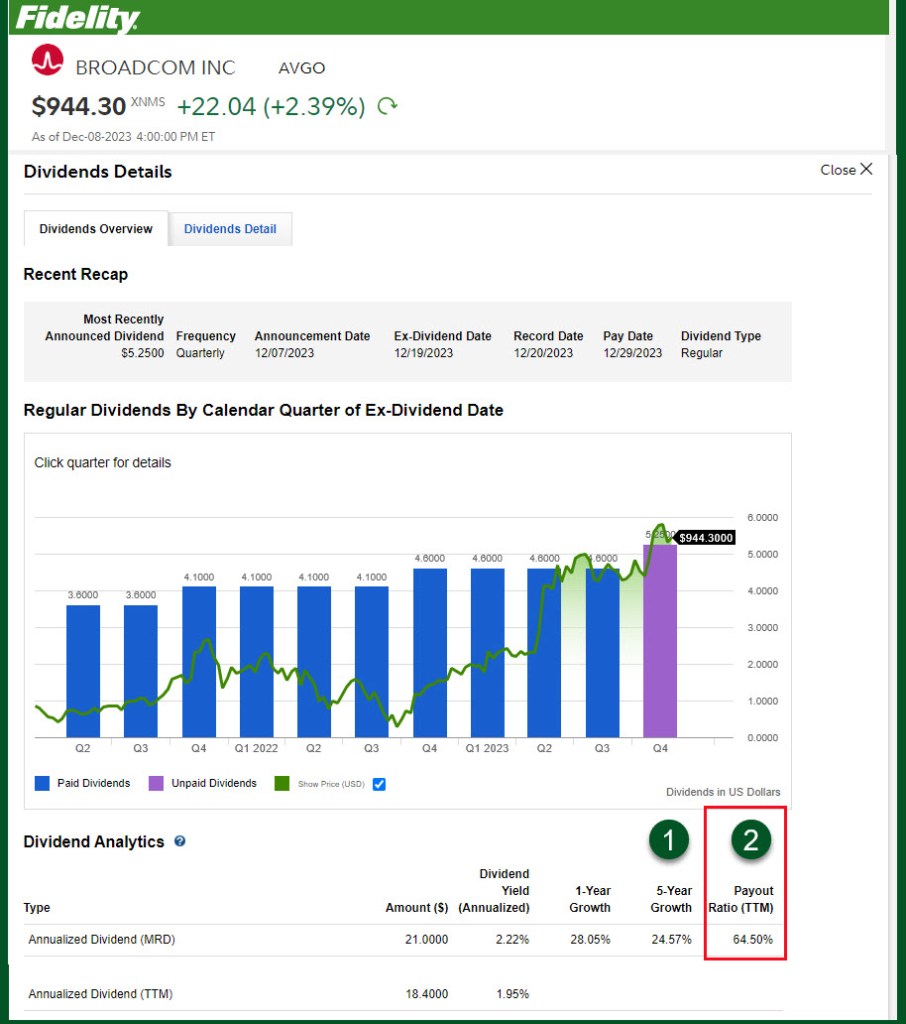
The lesson to learn from this is to buy shares of a quality stock or ETF and then ignore the noise. You should also notice that Fidelity’s way of calculating the dividend payout ratio is based on the TTM (Trailing Twelve Months.) This is a conservative view but probably overly cautious.
Seeking Alpha’s dividend chart can be adjusted from 3 years to five, or ten or to the maximum for the data. I prefer this longer view of the company’s track record. You might also notice that SA’s five-year dividend growth rate is different from Fidelity’s. I don’t worry about this, but it is a reminder that not all web sites do the same calculations for many pieces of the puzzle. Fidelity neglects to show an important piece of data: the number of years the dividend has been growing. It is twelve years.
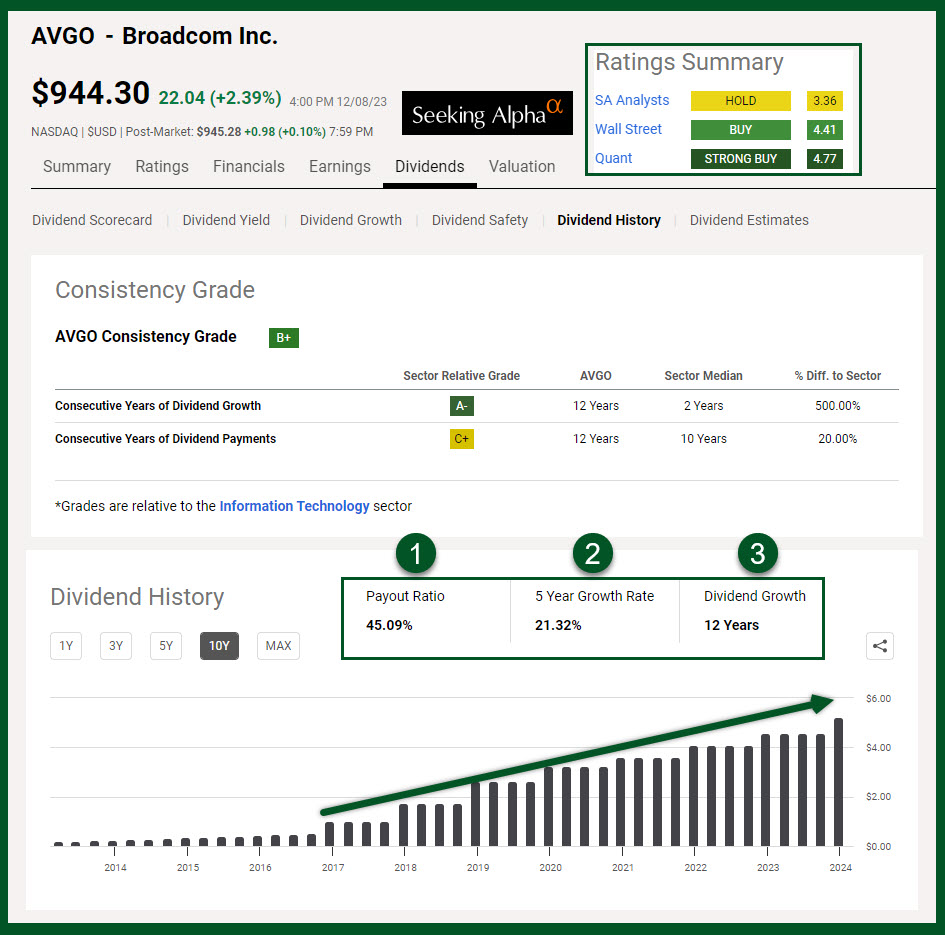
Seeking Alpha’s dividend payout ratio is more attractive than Fidelity’s take on this metric. I suspect that SA is using forward projected earnings rather than the TTM value. The projected future earnings, most of the time, is a rational way to evaluate the safety of the dividend. Any payout ratio below 50% is a reasonably safe value for a growing tech company.
StockRover also shows dividend growth with their graph. The nice thing about SR is that they also show returns. That is only helpful if you have held the shares for a long time and have reinvested the dividends. But it also shows the power of buying an investment and sticking with it.

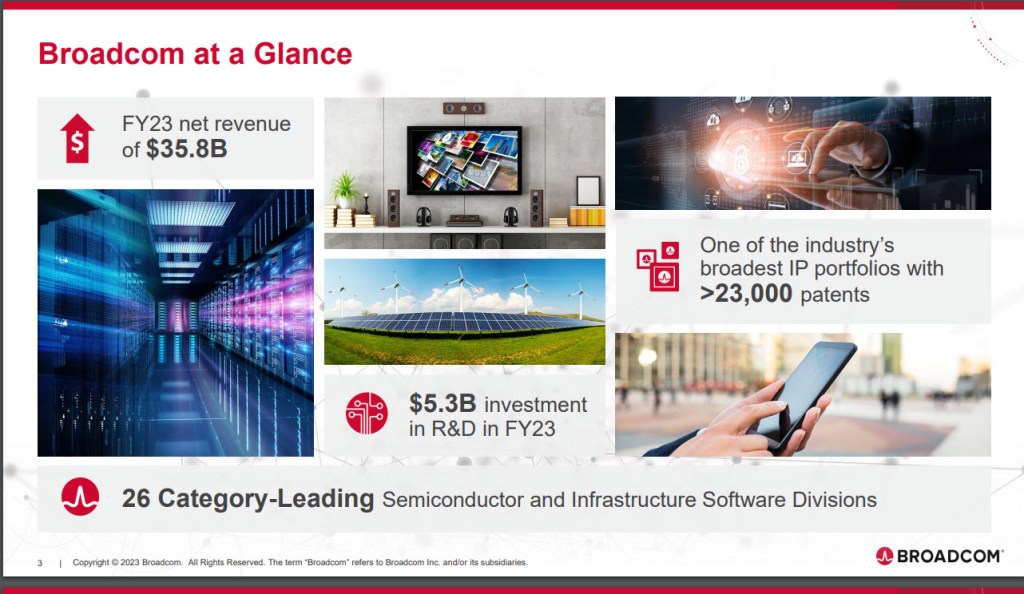
Understanding Broadcom’s Business
I venture to guess that most people don’t know what Broadcom does. The lengthy text description on Seeking Alpha is a lot to digest. Sometimes it is easier to go to a company’s website and look at the materials available to investors. I did that for Broadcom to look at the December 2023 investor presentation. Five of the presentation slides, which follow, help provide a less confusing look at Broadcom’s business.
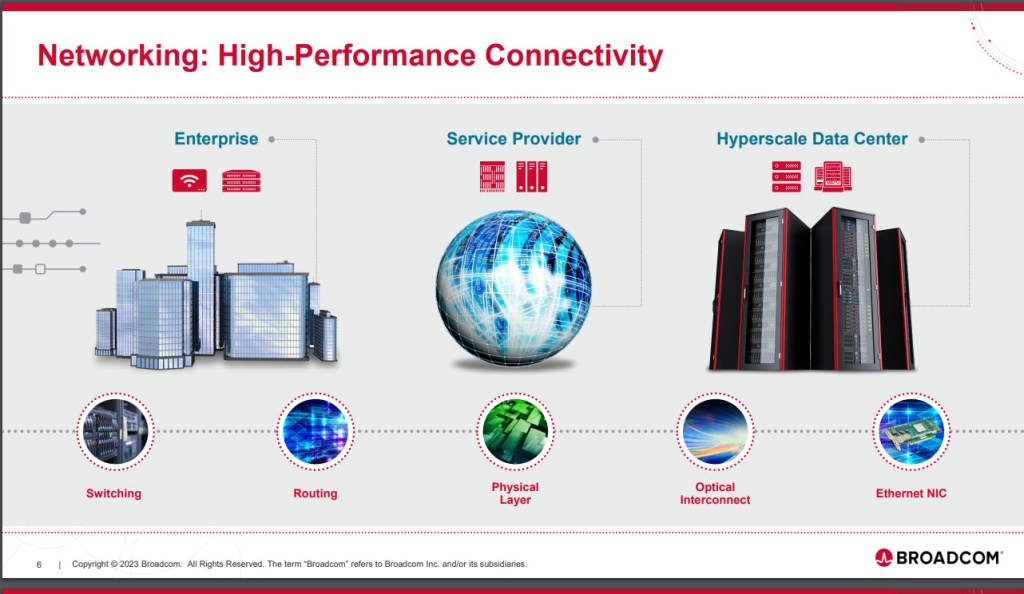
Source: Broadcom’s Investor Presentation: December 2023 Page 6
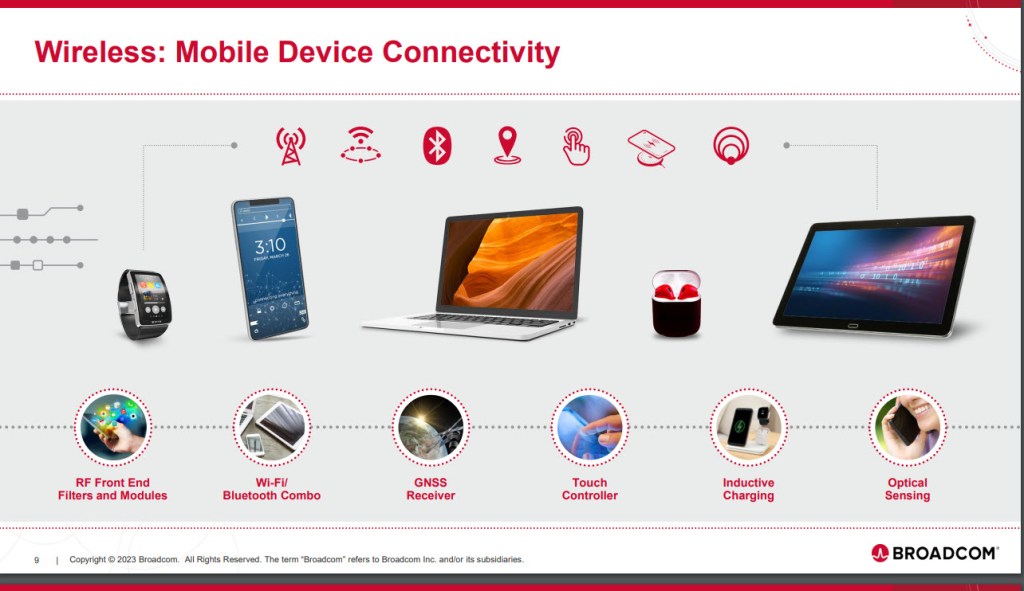
Source: Broadcom’s Investor Presentation: December 2023 Page 9
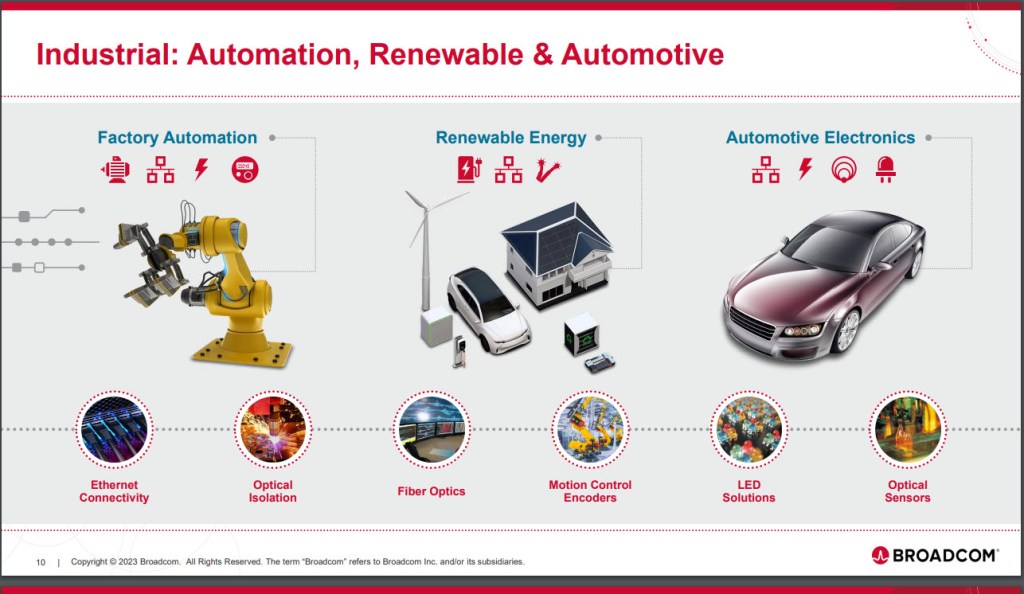
Source: Broadcom’s Investor Presentation: December 2023 Page 10
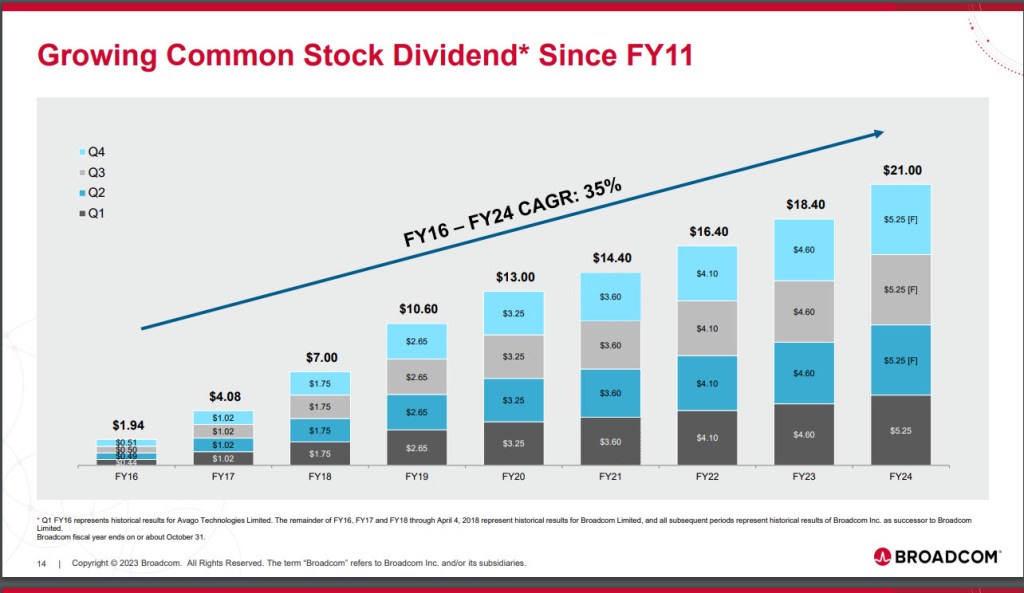
Source: Broadcom’s Investor Presentation: December 2023 Page 14
However, if you like the details, then read the next section: “Seeking Alpha’s Company Profile.” If you don’t care about the details, then skip past the company profile and read the final section. It is a good reminder that quality matters.
Seeking Alpha’s Company Profile
“Broadcom Inc. designs, develops, and supplies various semiconductor devices with a focus on complex digital and mixed signal complementary metal oxide semiconductor based devices and analog III-V based products worldwide. The company operates in two segments, Semiconductor Solutions and Infrastructure Software. It provides set-top box system-on-chips (SoCs); cable, digital subscriber line, and passive optical networking central office/consumer premise equipment SoCs; wireless local area network access point SoCs; Ethernet switching and routing custom silicon solutions; embedded processors and controllers; serializer/deserializer application specific integrated circuits; optical and copper, and physical layer devices; and fiber optic components and RF semiconductor devices. The company also offers RF front end modules and filter; Wi-Fi, Bluetooth, and global positioning system/global navigation satellite system SoCs; custom touch controllers; custom touch controllers; inductive charging; attached small computer system interface, and redundant array of independent disks controllers and adapters; peripheral component interconnect express; fiber channel host bus adapters; read channel based SoCs; custom flash controllers; preamplifiers; optocouplers, industrial fiber optics, and motion control encoders and subsystems; light emitting diode, ethernet PHYs, switch ICs, and camera microcontrollers. Its products are used in various applications, including enterprise and data center networking, home connectivity, set-top boxes, broadband access, telecommunication equipment, smartphones and base stations, data center servers and storage systems, factory automation, power generation and alternative energy systems, and electronic displays. Broadcom Inc. was incorporated in 2018 and is headquartered in San Jose, California.
One Final Word when Comparison Shopping for Stocks
It is far better to buy one share of AVGO for $945 than to buy 100 shares of (AMC) AMC Entertainment Holdings, Inc. for $693. Don’t fall into the trap that a lower-price means the stock is a good deal. AMC has negative earnings per share and no dividend. It is ranked 3,158 out of a possible 4,592 investments on Seeking Alpha. AVGO, on the other hand, is ranked 189 out of the same 4,592 investments.
