
Using Seeking Alpha to Review Key Holdings

A long-term investor does not just “set it and forget it.” That isn’t to say that the long-term investor is always on the alert. The market is a petulant child, and it throws tantrums. For example, the recent tantrum included a pummeling of technology sector stocks. I have technology-related investments in our portfolio and in the top ten investments in our portfolio. My discussion focuses on the health and long-term well-being of the top ten, as it makes up 43% of our total investment mix. Thankfully, Seeking Alpha provides amazing tools to make this very easy.
Annual Physical Exam
I don’t go to the doctor every month or even every quarter. My health and current condition don’t warrant that type of frequency. However, an annual physical is probably a wise course of action. In the same way, most investors should not review their investment choices more often than quarterly. Annual reviews are probably a better course of action. Therefore, as 2022 draws to a close, it is my time to do a review of at least the top ten positions in our investment portfolio.
Profitability, Performance, and Perceptions
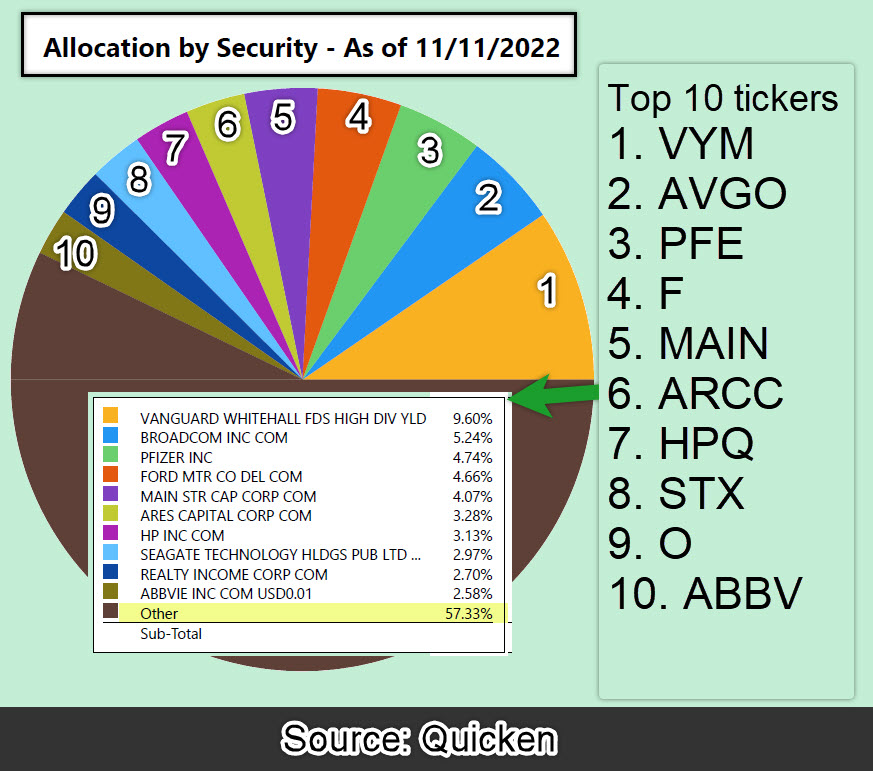
While dividend growth is a key element of my strategy, you cannot have dividend growth without growing revenue and consistent profitability. Thankfully, Seeking Alpha provides the tools I need to monitor my top ten investments. It is as easy as entering the ten ticker symbols into a “portfolio.” I created a portfolio I called Wayne-Top-Ten. The data that is then presented is broken into categories of information with tabs along the top.
Categories for Portfolio Review
I created a tab called “My View” to bring together data pieces of information from the other tabs. The other tabs are Summary, Holdings, Ratings, Earnings, Dividends, Valuation, Growth, Momentum, Profitability, Ownership, and Debt. Most of these are of some interest to me, but a few of them are really my focus. I’m interested in ratings, earnings, dividends, growth, and profitability.
Valuation has some interesting data, including the P/E ratios, Price/Sales, Price/Book, and Price/Cash Flow. However, at some point you have to limit what you look at. Data overload won’t help me make decisions. What follows are the screens that help me make my decisions.
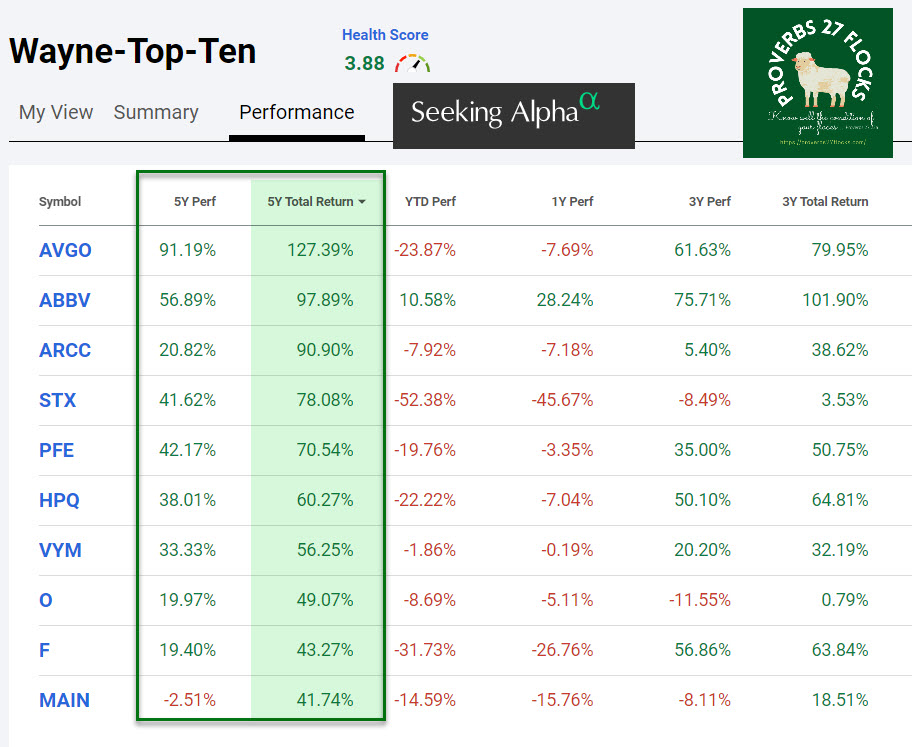
5-Year Total Return
This number includes dividends in the total return. Of course, total return is only valid if I sell the shares today. The price/share can vary from year to year and even month-to-month.
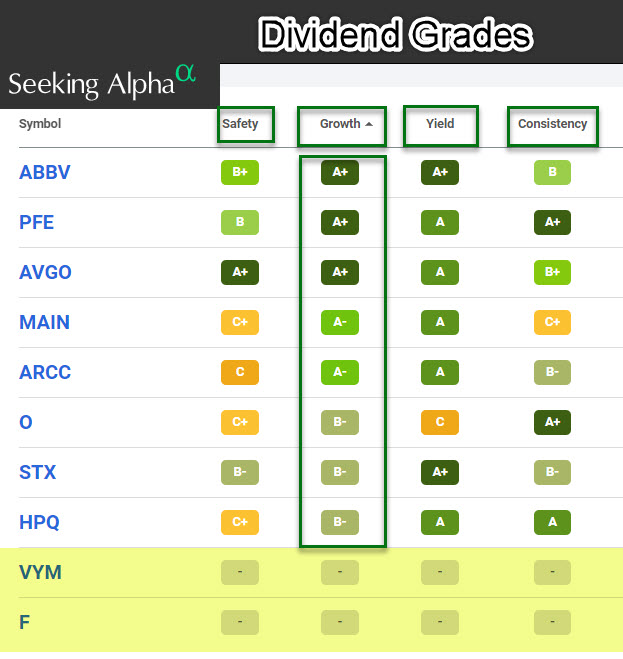
Dividend Growth Grades
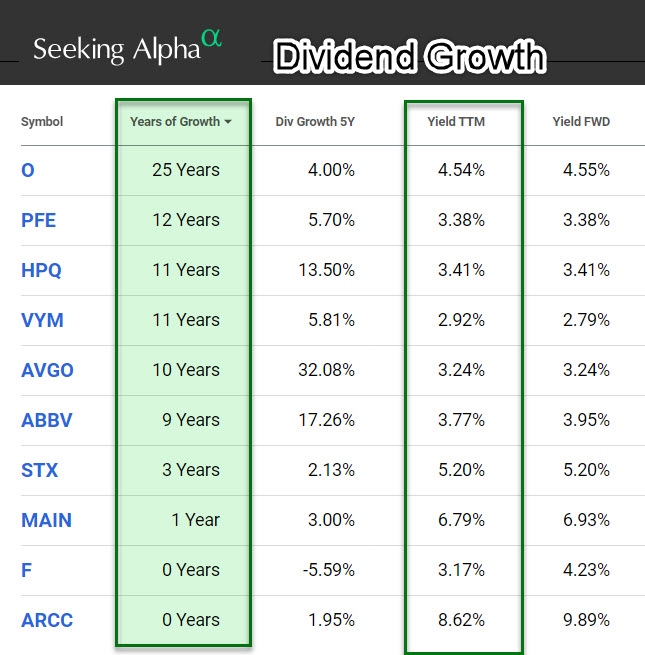
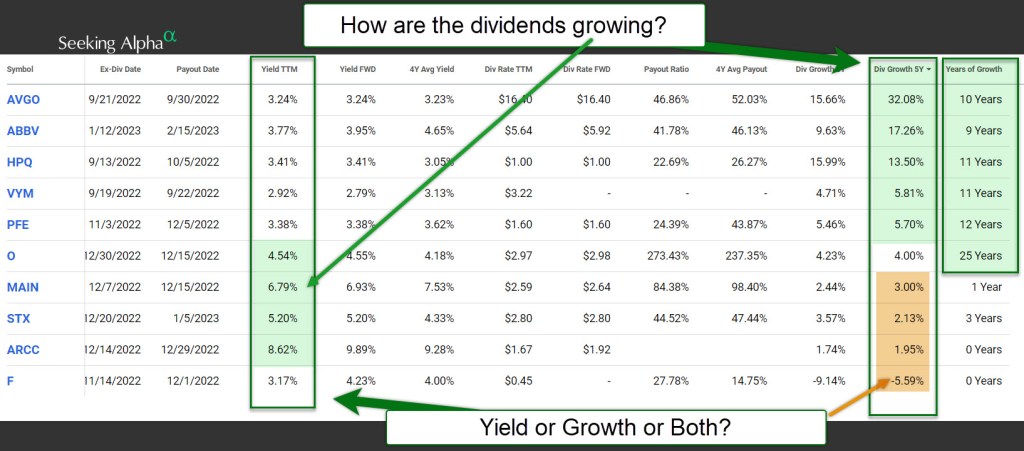
For the most part, I buy investments with dividend growth in mind. Therefore, it is not a shock that my top ten have that as a focus. VYM, the ETF, and F (Ford) don’t have grades. However VYM is a dividend growth ETF and Ford has potential, in my opinion. The second image shows the years of dividend growth. Clearly, the longer a company has been showing dividend growth, the better the chances that they can continue to do so. The dividend growth rate is also of interest to me. Given inflation, I would like to see a dividend growth rate of at least 3%. There are, however, always exceptions. An investment like MAIN is for monthly dividends more than for outstanding dividend growth.
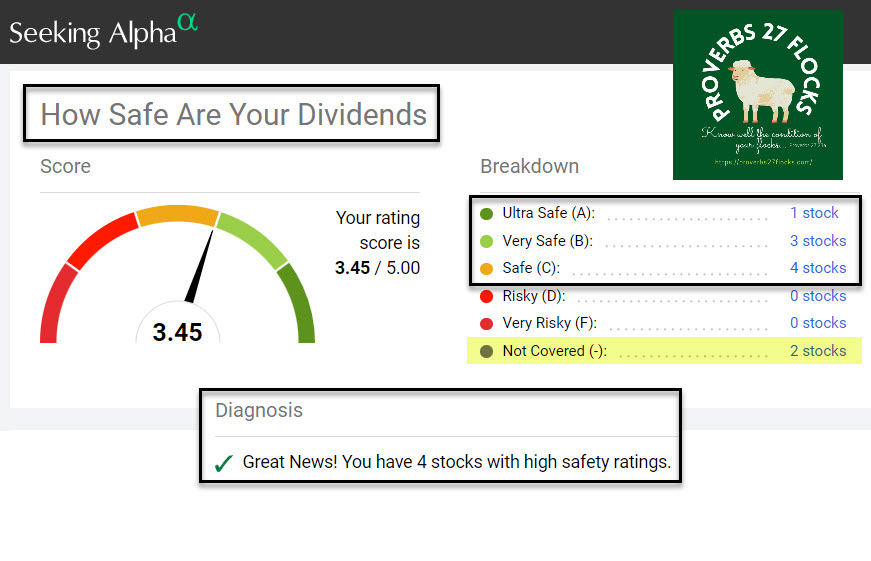
Seeking Alpha Portfolio Health Score
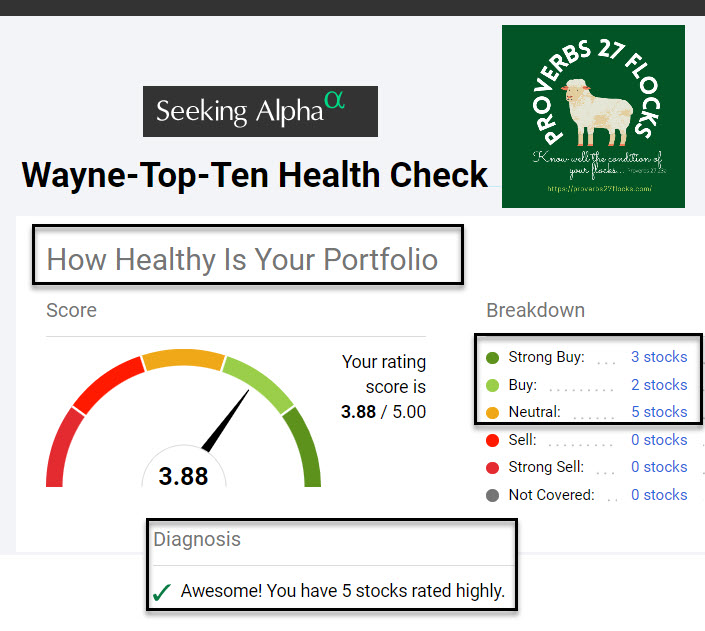
One cool feature of the paid Seeking Alpha subscription is their “Health Score.” Our current health score for the top ten investments is 3.88 out of 5.00. By way of comparison, my granddaughter Mia’s health score for her UTMA account is 4.43. All of the UTMA accounts have a similar score because all of them contain essentially the same investments. What follows are three images that visualize the portfolio, dividend safety, and strengths/weaknesses of my top ten investments.
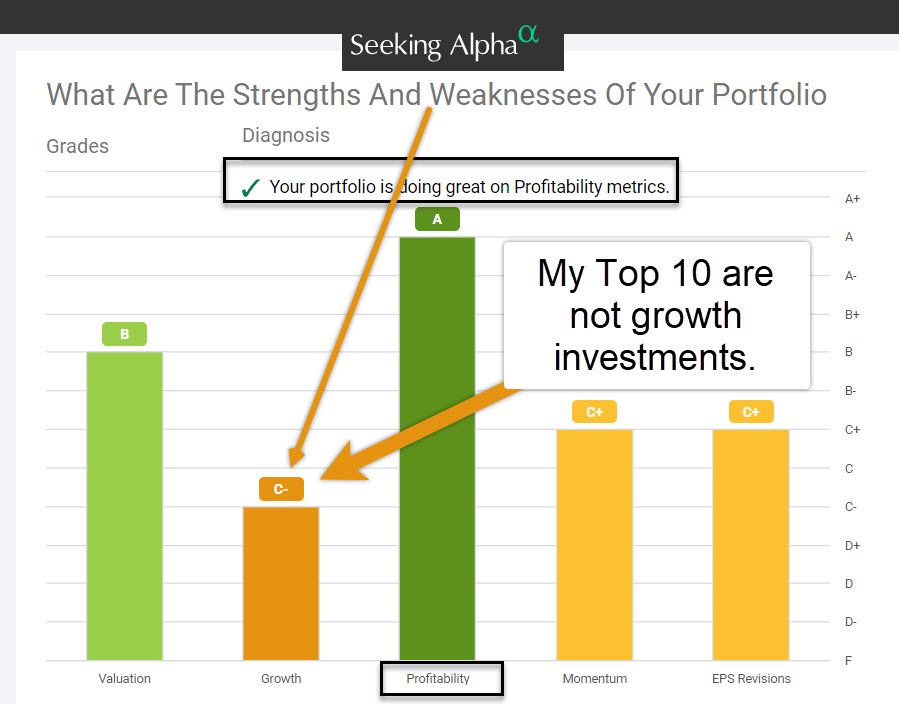
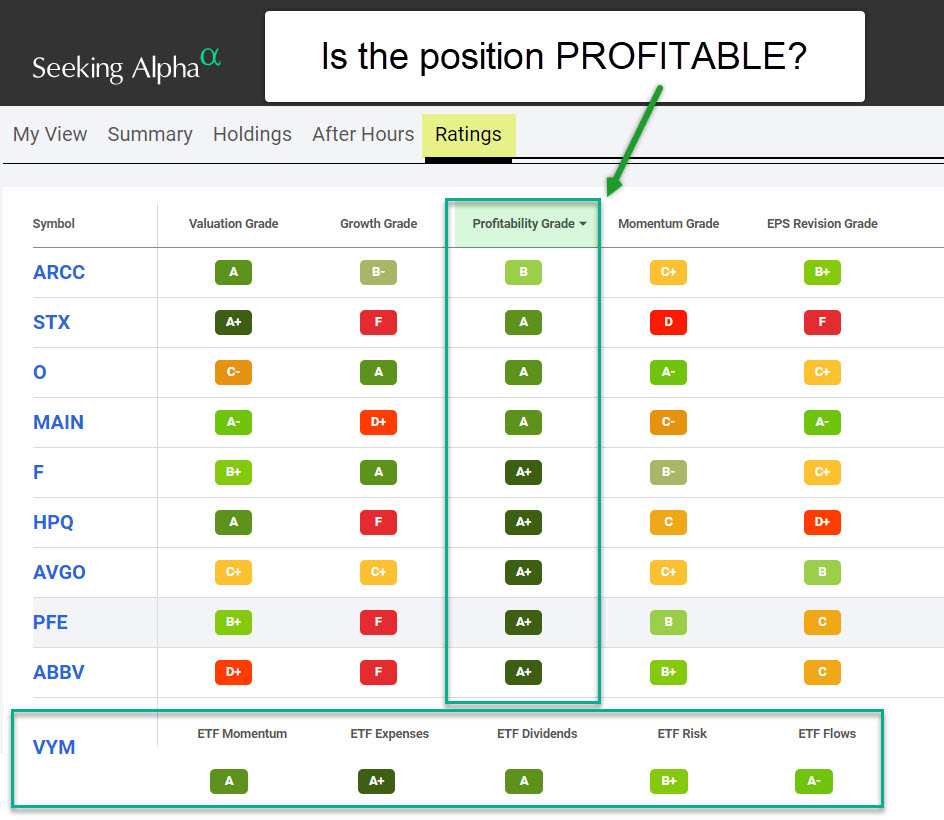
Profitability Grade
Some investments do not generate profits. While I have some of those, I really want to focus most of our investment dollars in solid companies with solid profits. As you can see from this illustration, ETFs won’t have this grade. ETFs, however, must have a good ETF Dividends score.
The QUANT Score

Although the QUANT score won’t prevent me from holding an investment, when I buy it I want to see a good score. This can fluctuate over time. It is important to note that none of my top ten investments has a RED QUANT score. Some of my investments do have that high-risk warning flag, but I don’t want to see that in my top ten.
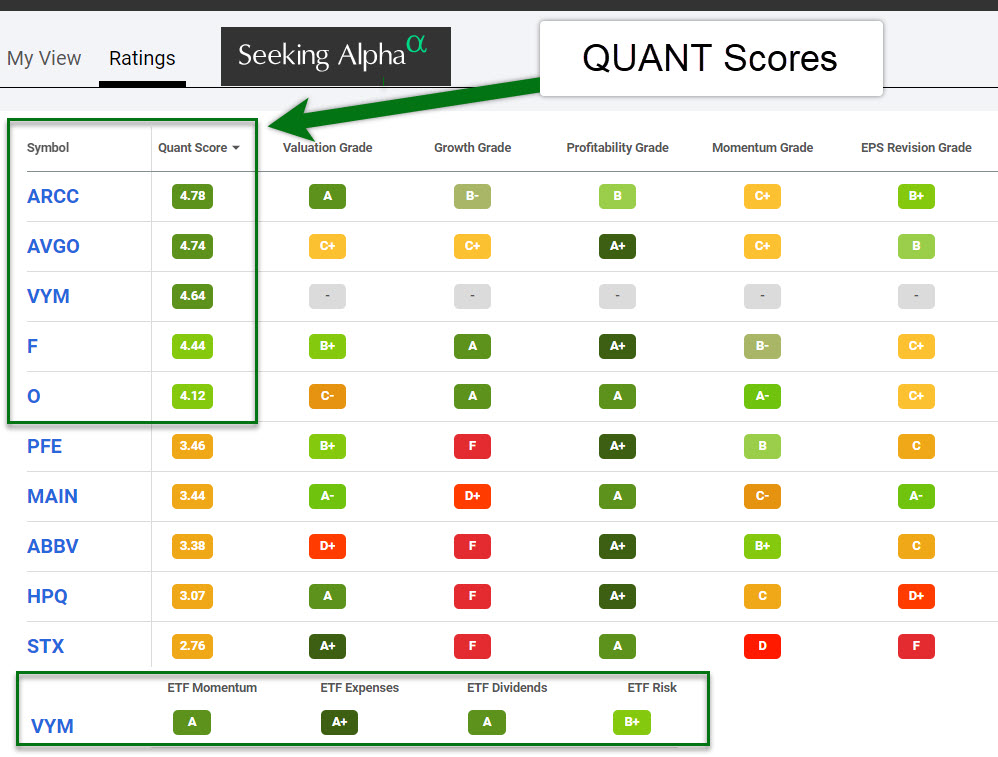
The other nice thing about the Seeking Alpha interface is that you can sort the data on any column just by clicking on the column heading.
Do You Want a Health Checkup?
Perhaps you don’t have a Seeking Alpha subscription. If you are curious, I can create a portfolio for you if you send me your ticker symbols, separated by commas. So, for example, if you have Apple, Ford, Amazon, and General Motors in your portfolio, you would send me this: APPL, F, AMZN, GM.
If you have a subscription, you can create your own portfolio. If you have questions, please contact me and I will do my best to help guide you through the process.
Full Disclosure
Although these are our current top ten, it is not always wise to follow my lead. For example, if you have limited time for investing, then stick to ETFs. If you want to be more specialized and diversified into specific companies, use a plan that will force you to make decisions based on data, not on my opinions.
