

Fidelity Investments Active Trader Pro (ATP)

Fidelity offers a wonderful tool for “active” traders. However, that name is misleading. You don’t have to trade actively to benefit from ATP. In fact, most investors who want a nice, customizable, way to view their investments, graphs, activity will also benefit. The best feature is the one I use daily. It is the window called Trade Armor. In this post I will only show you the main blades of this incredible tool. At the end there is also a link to a video in my Dropbox that you can watch to see how I was using the tool in 2020. There is also a link at the end to take you to Fidelity’s web for more information about ATP. You can download the software from that web page.
The Main ATP Tool
The primary ATP tool that I use anytime I am on ATP is Trade Armor. Trade Armor can help you see many important data elements about a stock or ETF you own or one that you are considering buying. This includes indicators for 52-week high stock prices, 52-week low, resistance, support, cost basis, current G/L (profit or loss), information about any capital gains or options income, average cost of your shares, expense ratios, earnings date and information, dividend-focused information, and even the top holdings if you are looking at an ETF.
In addition, if you are trading options, like Covered Calls, you can see all of the data you really need to enter options trades. I never use Fidelity’s web site for options trading. It is too clumsy. The ATP tool, on the other hand, is amazing.
Finding Trade Armor
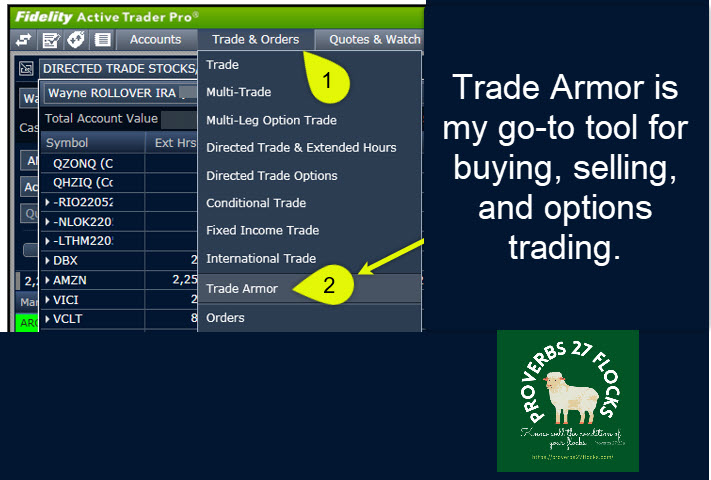
The following image shows how you can access the Trade Armor Tool. From the top menu, select Trade & Orders. Then select Trade Armor.
Trade Armor Resistance Support High-Lows
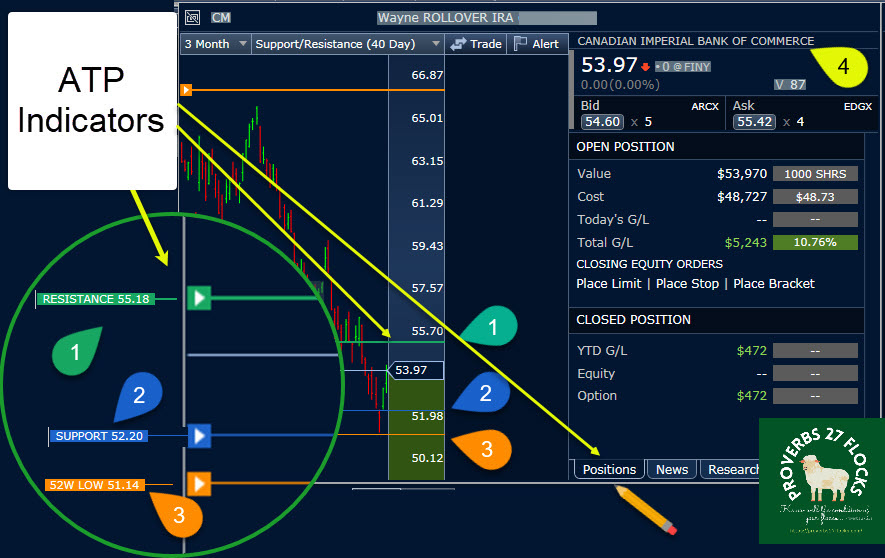
There are colored lines on the graph that help you see the behavior of the stock or ETF price over time. You can choose the timeframe you want to use for the graphing. I prefer 3 months, as that is generally enough time to see the way the price is changing. In this image we are looking at my position in CM (Canadian Imperial Bank). In addition to the indicators, I can see my cost basis and my YTD G/L from trading CM covered call options. In addition to dividends, I have gained $472 in options income. If you hover over the lines on the graph, little pop-ups appear to tell you the meaning of that line. Although I won’t talk about it in this post, you can also set price alerts using Trade Armor.
Trade Armor and ETFs
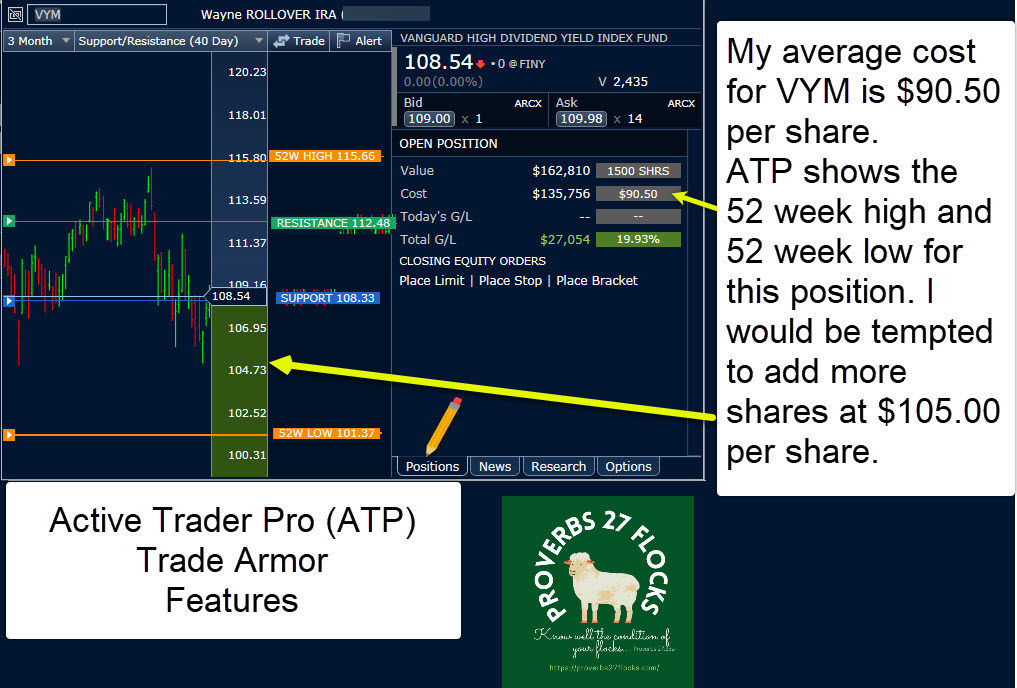
Because I have a lot of shares of VYM, the following image is most helpful. In the case of VYM, the price movement has been tighter in the last three months. Therefore, I can see the 52-week high price and the 52-week low. The same features are available for entering orders or price alerts.
Research Tab

The research tab is useful. Before I place a buy or sell order for an ETF or stock, I always look at three things. 1) If it is an ETF, I want to see the expense ratio. I want the cost of owning the investment to be less than 0.10% most of the time. 2) For an ETF I want to see what the largest investments are in that ETF. 3) Finally, I want to see dividend information, including yield, the Ex-Dividend date, and the total annual amount and yield. For stocks, some similar information appears. However, the information is stock-centric, so it shows information like the next earnings date and also the current Fidelity rating for the stock. This all can be seen on the Fidelity web site, but this is so much faster.
Options Tab Illustration 1

When I want to consider doing an options trade, ATP Trade Armor is the best tool for the job. Most of my options trades are covered calls, followed by cash covered puts and rolls. It is also easy to see if the position doesn’t have options, if the options are monthly or weekly, and the estimated income if I sell an option. In the following image I am considering selling a covered call of fifteen contracts (1,500 shares of VYM) on various monthly dates. I could make $4,650 in a single trade if I was willing to sell a covered call on 1,500 VYM shares at $112 per share. Of course, I have to keep the shares until October 21, 2022, if someone buys my contract. I would not enter an options trade that expires more than a month out, so I might be tempted to sell the contract for June 17.
Options Tab Illustration 2
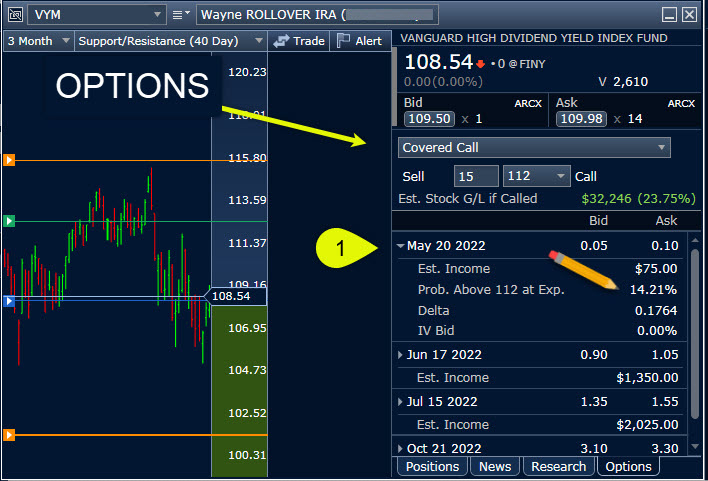
When I set the share price of the contract, in this case $112, I want to know the probability of having my shares called away. For a long-term holding, I don’t want this to be more than 15-20% unless I really want to see the shares called away. So, for example, if the “Prob. Above 112 at Exp.” is 50%, there is a high likelihood that my shares will be called away on or before May 20.
Summary

ATP can be your Swiss army knife for so many different tasks, including research, price alerts, price trends, entering buy/sell orders, and options trading. While all of these can be done on the Fidelity web site, it is far more clumsy and time-consuming to do this there. I give ATP ten stars out of ten.
ATP VIDEO: LINK
FIDELITY ATP: LINK
