
Advisors Fall Into Different Categories

When I am considering an investment purchase, I certainly look at data. I want to know some basics about each investment. Most investments have to fit within my dividend growth model. But I also accept investments that fall outside of that model. Because I want to save time, I like Seeking Alpha’s tool for providing the buy/sell ratings. However, there are three ratings, and they are not equal in value.

The first rating is called the Seeking Alpha Authors rating. Various individuals with varying degrees of skill give their thoughts about an investment. Needless to say, they can be terribly wrong. However, it can be helpful to read their opinions and why they are bullish or bearish on an investment.
The second rating is the Wall Street rating. Because Wall Street likes to focus on a limited number of investments, and generally has positive views of many investments (for their own benefit). For example, General Motors (GM) has a bullish Wall Street rating of 4.47. I think that is overly optimistic.
The third rating has more value, in my opinion. It is called the Quant rating. It is updated daily before the market opens. So, for example, GM has a neutral (3.46) rating instead of the more glowing 4.47 opinion of Wall Street. Even the SA Authors are a tad less optimistic about GM than Wall Street: 4.00.
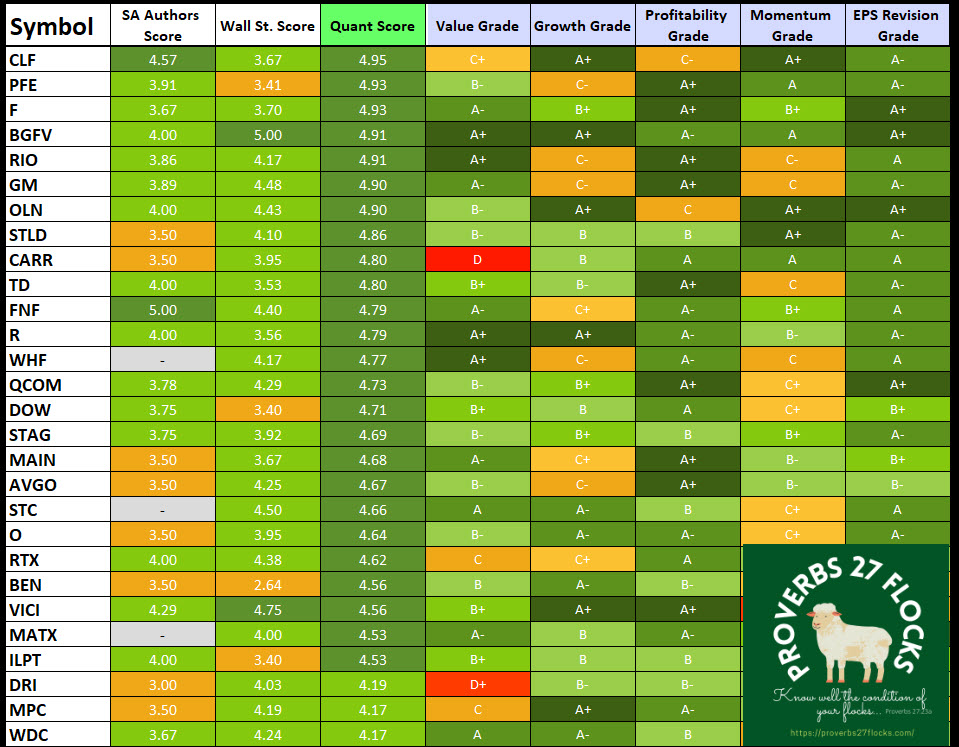
Top Quant Scores in my Traditional IRA
In the following image I sorted the download from Seeking Alpha on the QUANT score. As you can see, the opinions of SA authors and Wall Street can vary considerably. In addition to those three scores, you can see the factor grades for value, growth, profitability, momentum, and EPS revisions.
Sectors Matter
One other thing I like about the SA rating system is that it compares apples with apples. It is silly to try to compare a tech company with a consumer company or a REIT. Apple and Coca Cola are not peers in business or growth. Therefore, Quant Ratings and Factor Grades are built on a comparison of stocks to others in the same sector, instead of a comparison of all stocks to each other. “Different sectors have different aggregate profitability and growth rates, and therefore trade at different average valuations. Comparing a stock to others in its sector is therefore more relevant and informative than comparing it to stocks in other sectors.” – from Seeking Alpha
Comparing Companies
Because of the way this is handled, it is possible to enter a ticker symbol like AAPL and see rational peers to Apple. This is sometimes wonky. For example, Seeking Alpha thinks Dell is like Apple. However, if you start with Dell (DELL), you will see HPQ, NTAP, and STX.
Download Data from Premium
The beautiful think about the Seeking Alpha premium subscription is that you can link your brokerage or IRA accounts to SA and then download a host of valuable information about your positions. For example, the downloaded spreadsheet has sheets that cover a summary, holdings, ratings, earnings, dividends, value, growth, performance, momentum, profitability, ownership, and debt. In other words, you get some rich data for analysis, if you are so inclined. You can then sort the data by many different values. The following image is an example of the spreadsheet tabs.

What are Seeking Alpha’s Quant Ratings and Factor Grades?
“Seeking Alpha’s Quant Ratings are an objective, unemotional evaluation of each stock based on data, such as the company’s financial statements, the stock’s price performance, and analysts’ estimates of the company’s future revenue and earnings. Over 100 metrics for each stock are compared to the same metrics for the other stocks in its sector. The stock is then assigned a rating (Very Bearish, Bearish, Neutral, Bullish or Very Bullish), and a score (from 1.0 to 5.0, where 1.0 is Very Bearish and 5.0 is Very Bullish).” – From Seeking Alpha
The Five Factors
“Seeking Alpha grades each stock by five “factors” – Value, Growth, Profitability, Momentum and EPS Revisions. To do this, we compare the relevant metrics for the factor in question for the stock to the same metrics for the other stocks in its sector. The factor is then assigned a grade, from A+ to F.” – from Seeking Alpha
How are Seeking Alpha’s Quant Ratings and Factor Grades useful for investors?
“Seeking Alpha’s Quant Ratings Factor Grades provide investors with an instant characterization of each stock. This makes it easy to find or rule out stocks based on your investment criteria.
For investors wanting to do more research, the Quant Ratings and Factor Grades provide a springboard for further research. You can quickly see where a stock is strong or weak, and with one click you can view the underlying data and sector averages to perform your own evaluation.” – From Seeking Alpha
Is Seeking Alpha Premium Worth the Cost?
Yes. While Seeking Alpha is free for most articles upon registration, the subscription-based premium membership is $29.99 per month or $19.99 if prepaid for the annual subscription. The membership provides full access to the site with unlimited conference call transcripts, articles, and investment tools. I pay annually, so I paid $252.15 (5.5% Wisconsin sales tax included) when my subscription renewed. If I save myself one investing mistake with better data, I save this amount without any difficulty.
Seeking Alpha Info Link: QUANT RATINGS
