

Some tools work best for pounding and some for turning, carving, cutting or smoothing. In the same way, some investing tools are specialized for specific purposes. Today’s post includes the next four investment sites I frequently use and that are set to open when I start my Chrome browser every day.
As I said last time, my Chrome browser is set to open a set of seventeen different websites. In my earlier post I talked about the Seeking Alpha subscription, Weiss Ratings and REITNOTES. Today I will share a few thoughts about two ETF-related websites and two that are more general in nature. Let’s start with the two related to ETF investing.
ETFCHANNEL
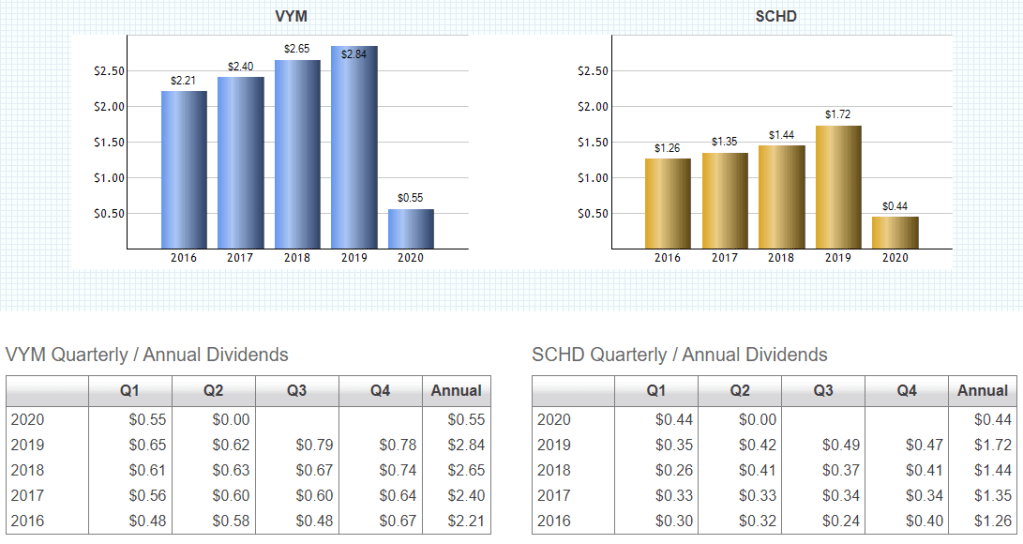
ETFCHANNEL is probably the best ETF-related tool I have found. It gives the ETF investor a lot of great information. This includes total assets, inception date, the expense ratio, the number of holdings, dividend yield, a list of all the holdings, the top sectors and sector concentration. For an ETF like VEU (Vanguard FTSE All-World ex-US) I can quickly see the 3,324 companies included in small chunks. In VEU the top holdings include Alibaba, Nestle, Tencent, Roche, Novartis, Toyota, Taiwan Semiconductor, Samsung, BP, Glaxosmithkline, Royal Bank of Canada and Sanofi. Unfortunately, the Country Concentration graphs for the foreign stock ETFs are useless. For VEU, it is better to use a website like ETF.COM. The following image illustrates the information for VYM.


ETFREPLAY
ETFREPLAY is a great way to compare the historical dividend payments of two different ETFs in table and chart format. So, for example, you can compare VYM with SCHD. Both have similar yields and expense ratios. There is an example shown below.
Buyupside and Wallmine.
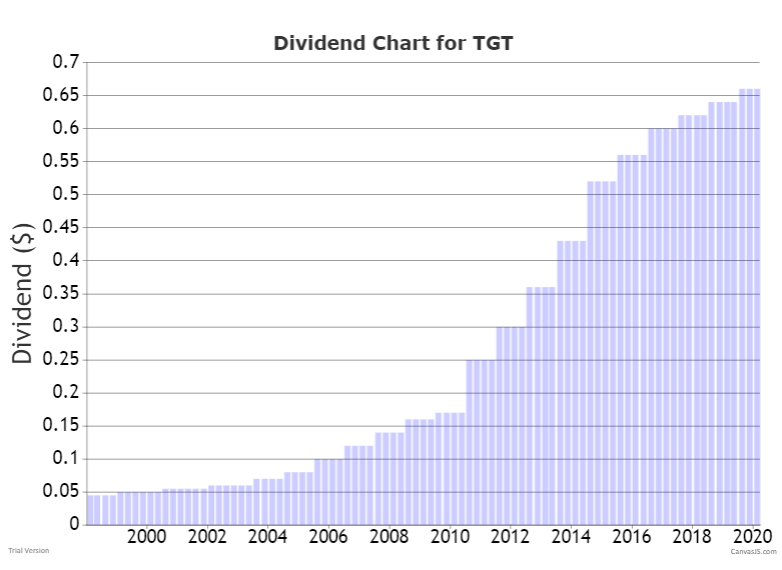
Buyupside is a very useful tool to see dividends for a specific stock like Target (TGT). Buyupside doesn’t do ETFs. The following chart using Target as an example illustrates one of the tools at Buyupside. There are also dividend growth rate and dividend reinvestment calculators, but I find the charting one most helpful for seeing how a dividend is growing (or not) over time. The link for charting is at the end of this blog post.
Wallmine contains a veritable treasure chest of information for stocks and ETFs. For a stock like TGT, there are all the expected values including Market Cap, Revenue, P/E, Employees, all of the needed dividend information and a host of more than 50 other items. Wallmine shows a stock price chart with the ability to adjust the timeframe. It also reveals other values you can select as needed. I also like the news feature, and the recent insider trading activity. The tool provides an overview of similar companies, a dividend chart, analyst ratings and a link to Target’s investor web page. One insider, Michael McNamara, is an executive officer and he sold over 2 million dollars of his target stock in August. This is not alarming to me, because he still holds a significant number of Target shares, so he might be diversifying his portfolio.

Wallmine also shows charts for Quarterly EPS estimates, Profit Margin, Debt-to-Assets and Cash Flow. It is almost a one-stop-shop for investors who don’t want multiple data and information sources. I’m thankful for the person who told me about this tool. I use it all the time, especially to see what insiders are doing during times of economic stress. The following image shows TGT competitors. We own shares of TGT, WMT and KSS.

Wallmine isn’t quite as useful for ETFs, but it does show some helpful information, including a chart for dividend history. Dividend growth investors want to see that information.

Here are some links to explore.
