
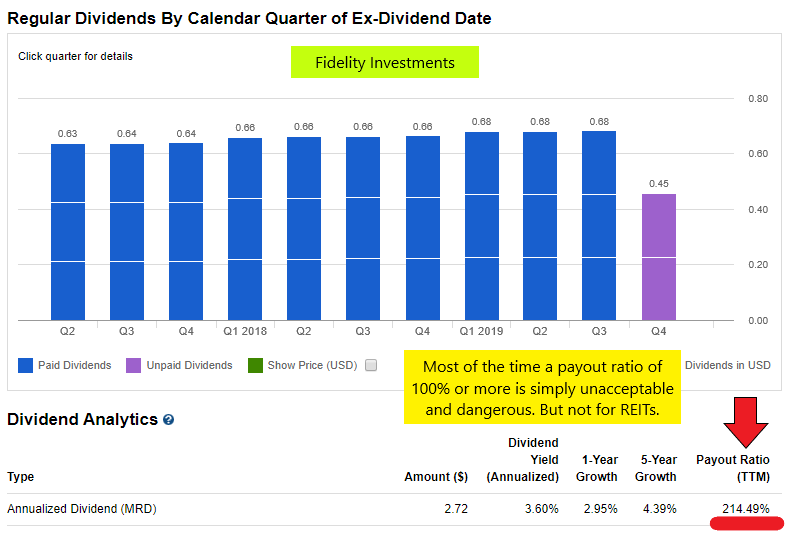
When you buy a REIT investment, some of the value and dividend metrics you would use for a “normal” stock do not work for the REIT. That is because REITs are different from most other investments. For example, the dividend payout ratio is meaningless and worthless on the Fidelity Investments web site. The reason is a bit complicated, so I won’t go into the details. Just understand this: for a REIT investment you don’t compare the dividend to net income. Instead, the comparison must be with a value known as FFO. FFO is the abbreviation for Funds From Operations. Even then, REITs have higher than “normal” payout ratios when using FFO as the value. It isn’t uncommon for the FFO payout ratio to be 70-80%. This isn’t bad by itself.
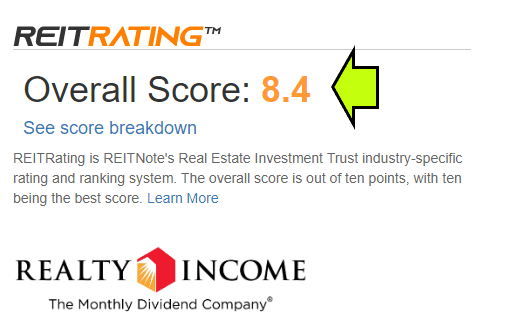
One free web resource that is helpful is called REITNOTES. When you sign up for a free account you can look at any publicly traded REIT to see various metrics. For example, you will see a “REITRATING™”, a stock chart, highlights for the trading day, dividend information, latest news headlines, Funds from Operations (FFO), Key stats (including the P/E ratio), the latest REIT community comments, a summary of the properties owned by the REIT, the occupancy rate (are their properties fully utilized?), the dividend history, the balance sheet, the income statement, cash flow and a very helpful rating scale that compares the REIT you are considering with the “average rating.” At the bottom there is even a “related REITs section, but that is of questionable value, in my opinion.
One of our REIT investments is a company that pays a monthly dividend. It is Realty Income Corp (Ticker: O). According to REITNOTES, “The company’s … monthly dividends are supported by the cash flow from over 5,000 real estate properties owned under long-term lease agreements with regional and national commercial tenants. To date, the company has declared 567 consecutive common stock monthly dividends throughout its 48-year operating history and increased the dividend 93 times since Realty Income’s public listing in 1994.” Occupancy is close to 100% and the dividend to FFO ratio is about 80%. This is noteworthy, because Fidelity and most financial sites show a “payout ratio” of more than 200%. For most stocks, that payout ratio is unsustainable and ridiculous.
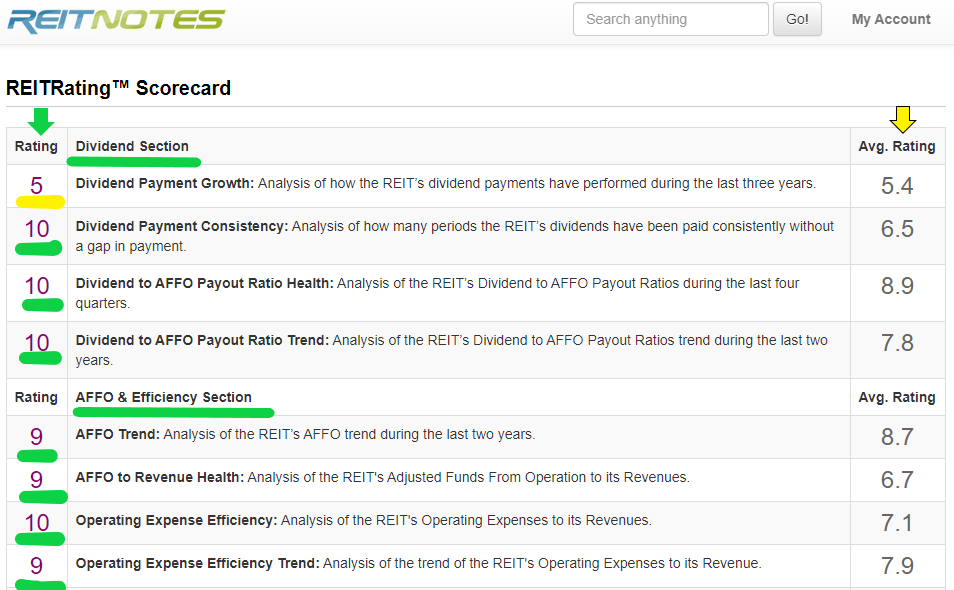
When you look at the REITNOTES section for their scorecard, you will see a “Dividend Section” and a “AFFO & Efficiency Section.” Although dividend payout growth is modest, all the other scores are 9-10 out of ten. This is far better than most. Also note you should look at the “Leverage section” to see how well the REIT manages debt. Realty Income’s “Debt Leverage Health Trend” is very good.
On the Realty Income web site, they anticipate the question about how they can pay a dividend that is greater than their “net income.” Their FAQ question is: “Why is our net income per share less than the amount of our dividend per share?” They answer it. You can go to the second link to see their answer.
Realty Income Investors Link: https://www.realtyincome.com/investors/default.aspx
Realty Income FAQ Link: https://www.realtyincome.com/about-realty-income/frequently-asked-questions/financial-performance-questions/default.aspx
