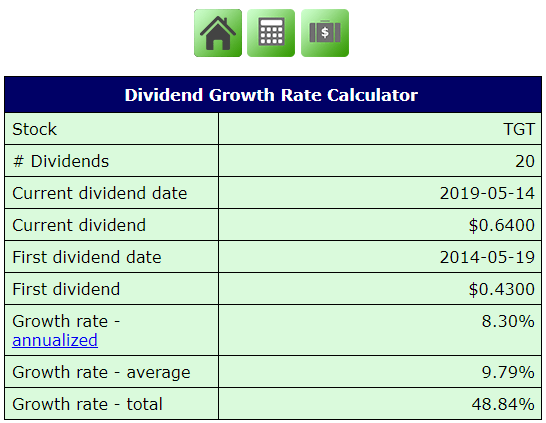
This tool is a great way to see an historical perspective of the gains to be had from a dividend growth rate for company stocks that pay a dividend. Unfortunately, this tool won’t work for ETFs or mutual funds, but if you own shares of Disney, Ford, AT&T, Target, Microsoft, Apple or other good companies, you can learn a lot using this free tool. It is very easy to use this tool. You only need to know the ticker symbol (like TGT for Target Corporation) and then pick the number of dividends to use in the calculation. So, for example, if you select “20” you will be getting five years of history because Target pays quarterly. If you select “40” you are getting ten years. I think ten years is a good measurement for companies that have been paying dividends for a long time. Much more than that probably isn’t meaningful.
You start at this web site: https://www.buyupside.com/calculators/dividendgrowthrate.php
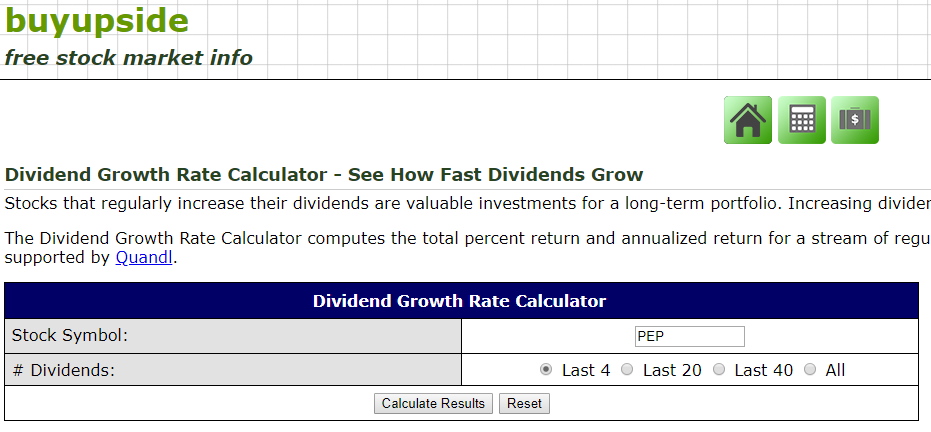
After you enter the ticker symbol and select the # of Dividends, just click on Calculate results. The goal of a dividend growth investor should be to see dividends growing. So if you look at the illustration for Target, you will see that the annualized growth rate is 8.3% over five years. How would you like to get an 8.0% pay raise at your job every year? I never did unless I switched to a new company.
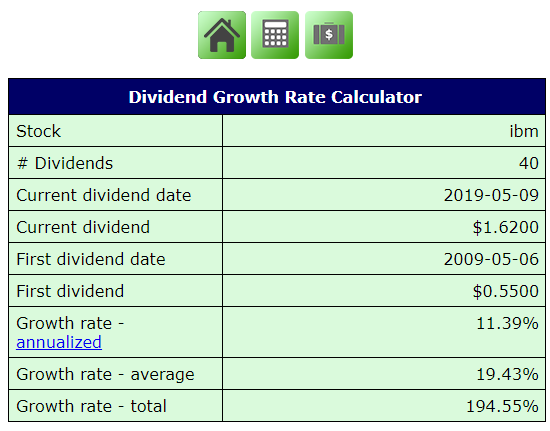
Here is what IBM looks like: