
Thursday Tool – ETFreplay.com
One of the web tools I use every time I am considering an ETF investment is one that is free to use. It is ETFreplay.com.
One of the best ways to use this tool is to enter the ETF ticker symbol in the first box at the top of the screen and leave the default of SPY (SPDR® S&P 500 ETF) for comparison purposes. You can also adjust the start date if you desire. Bear in mind that many ETFs are recent entries into the investment world, so some won’t have much history.
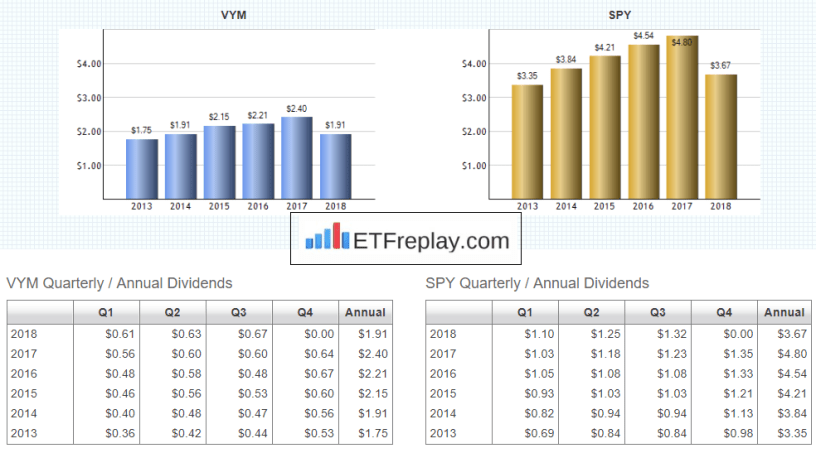
The picture with this post shows the comparison of VYM (Vanguard High Dividend Yield Index Fund ETF Shares) with SPY. There are two great things about this tool.
- You get a graph that shows you if the dividend is increasing, decreasing or bouncing around.
- You can see the payments in dollars for each quarter.
Now be careful. There are some things you cannot see in my illustration from ETFreplay that you should think about. These are:
- You cannot tell which one is actually growing the dividend at a faster pace by looking at the graph. In this case SPY is growing the dividend at a faster pace, but that may not always be the case.
- This web site doesn’t tell you is how much the initial investment may have grown.
- The portion of the tool in the snapshot above does not tell you the dividend yield or expense ratio. In this case the yield for VYM is higher than that for SPY. If you are looking for income, then VYM may be a better choice for yield. You can see the dividend yield in the top graph:

LINK: ETFreplay
| SPDR® S&P 500 ETF
Vanguard High Dividend Yield Index Fund ETF Shares |
|
