

Charting Your Investing Course

Does history matter when it comes to investing? It isn’t proof of the future, but it can help inform decisions about what to buy and what to avoid. As Barron’s says, “Investors aren’t generally motivated to look too far into the past. While history provides a guide to what’s likely to come next, it’s more of a compass than a GPS.” – The Barron’s Daily
A compass can help me go in the right direction. However, a GPS can tell me my current direction and tell me when I might reach my destination. The GPS also warns me of obstacles in my path. Most investing tools are more like a compass than a GPS. They can point you in the right direction and might help you avoid going in the wrong direction.
Pictures and Numbers
Because investing involves numbers it helps to know how to understand percentages and change. But numbers are cumbersome for humans to digest, especially if there are a lot of numbers. Charts and graphs make numbers far easier to understand. For example, when our church treasurer gives his quarterly report of the financial health of the church, he provides numbers, but he also provides various graphs. The graphs make it far easier to identify good and not-so-good trends in giving and in expenditures.
The same is true of investing. While it is nice to depend on some quick rating scores like the Seeking Alpha QUANT Rating, sometimes it helps to also look at some key investing metrics over time. For example, net income, total returns, and revenue growth are indicators of the health and growth of a business. Is the business going in the right direction, or is it going “south?” However, numbers can be overwhelming for the non-accountants.
Seeking Alpha Charts
Seeking Alpha provides a very flexible charting tool that gives the subscriber a way to see many different values in colorful graphical form. Once you understand how it works, you can also quickly copy and paste the “https” address and change the ticker symbols in that address to look at any position you desire. Bear in mind that the metrics you can select for individual stocks will be different from those available for ETFs. So, for example, an ETF does not have “net income.”
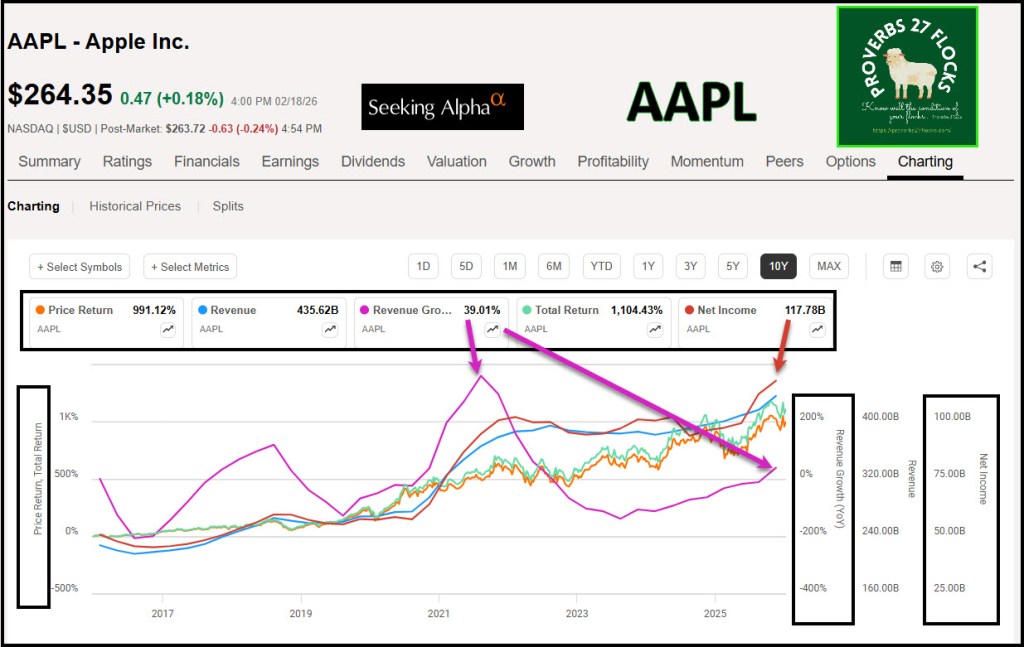
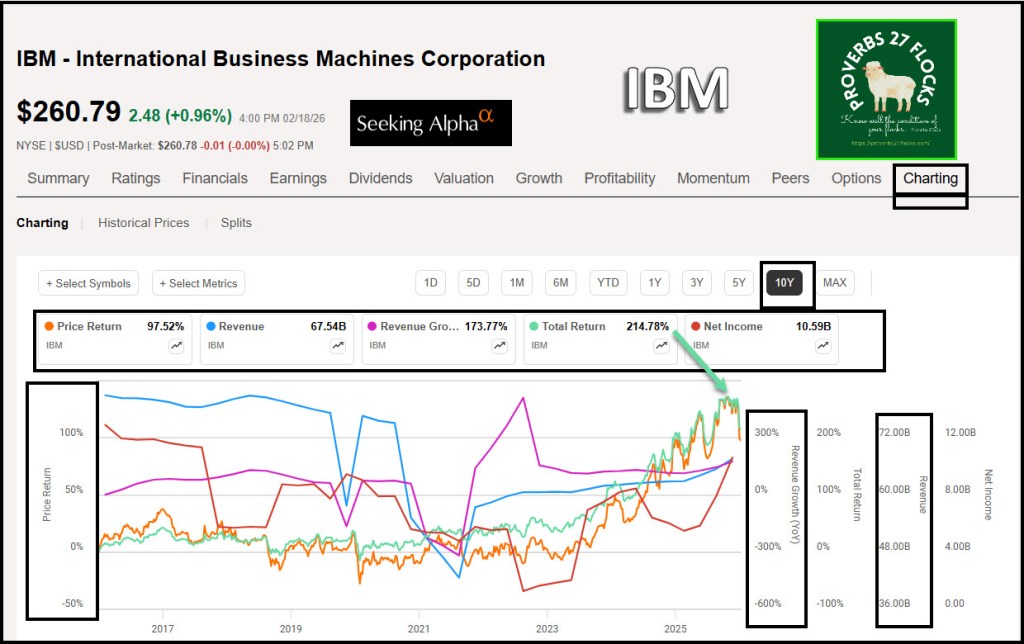
In this post I used three tech-related companies (AAPL, IBM, and NVDA), one BDC (TSLX) and one consumer restaurant (RRGB) to illustrate the power and usefulness of Seeking Alpha’s charting tool.
What To Chart?
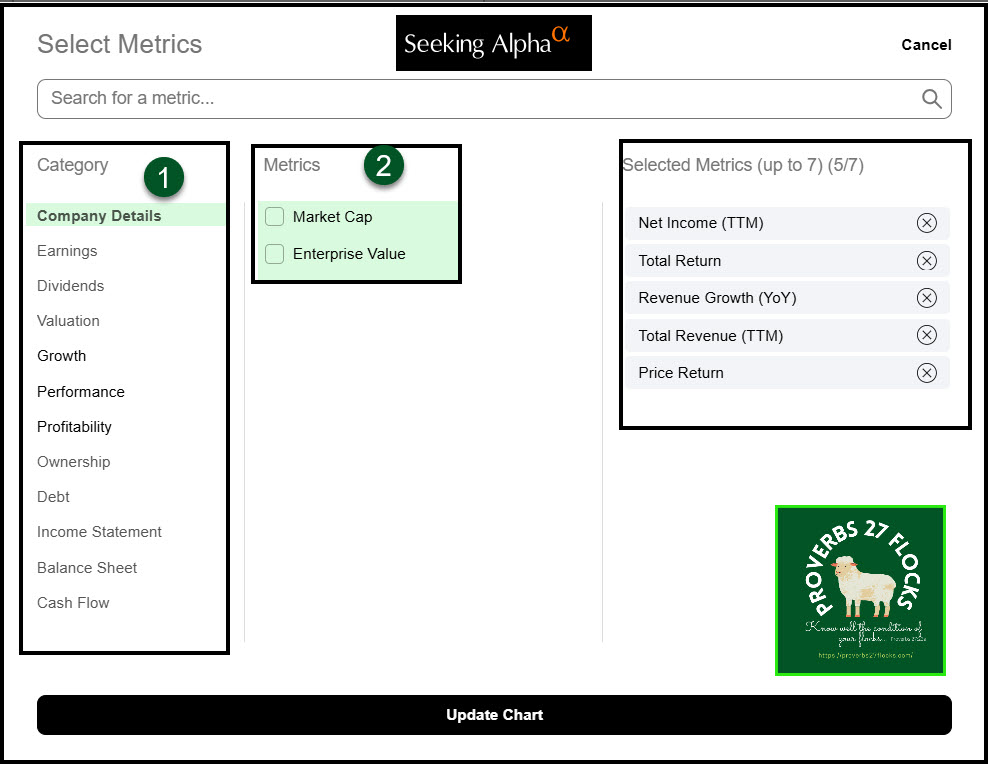
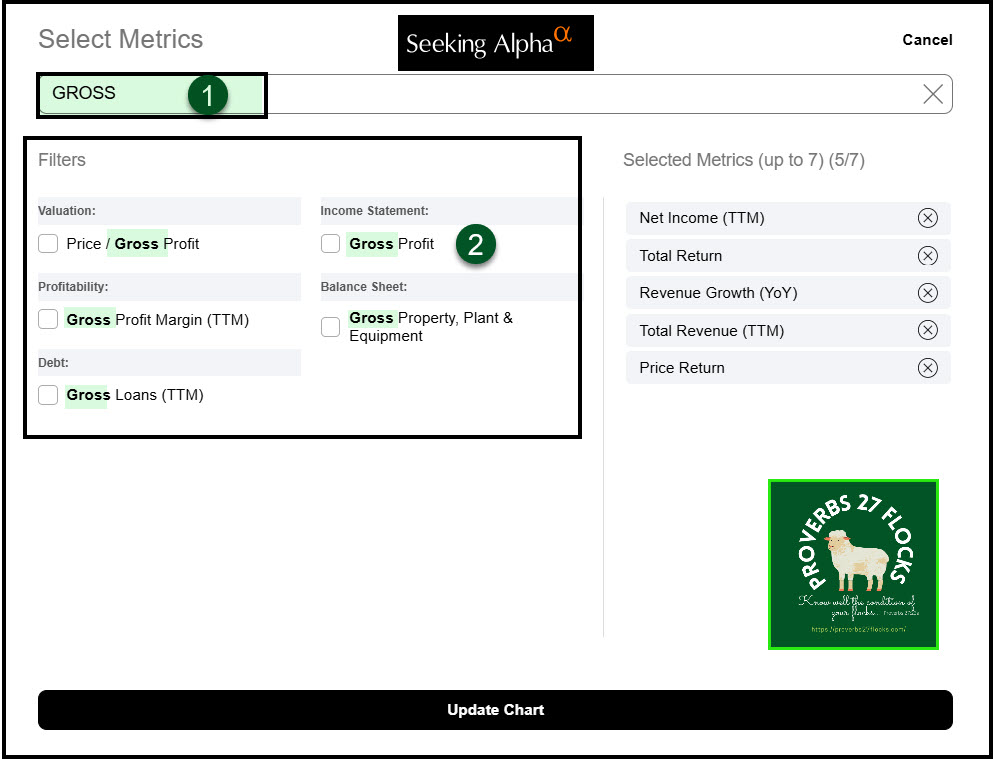
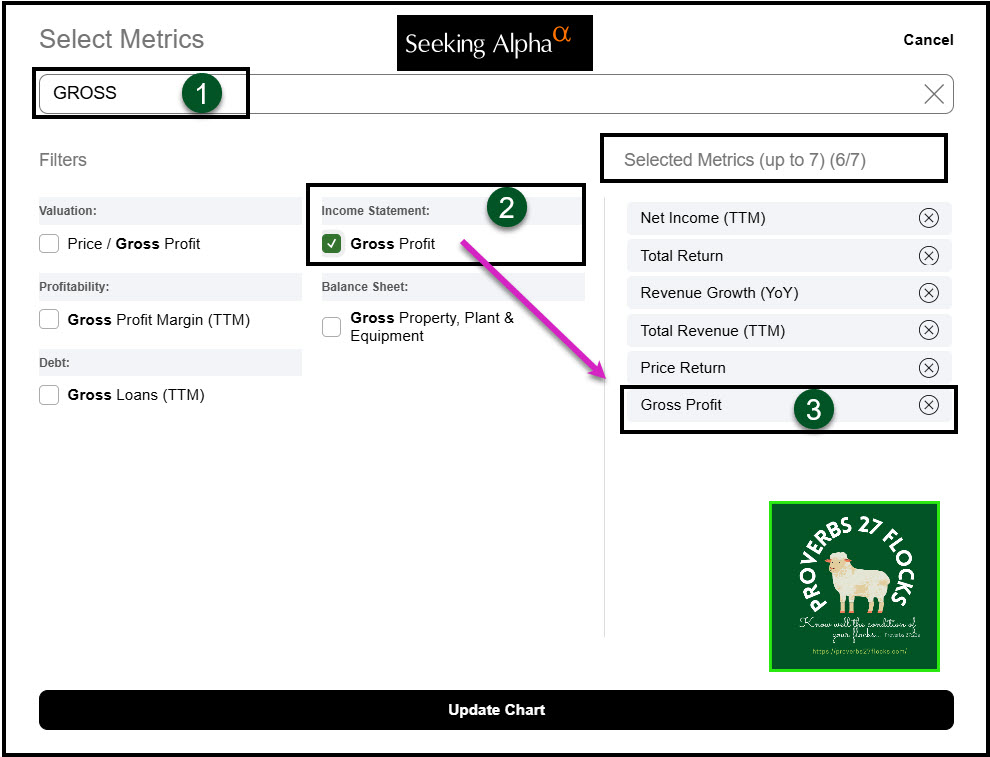
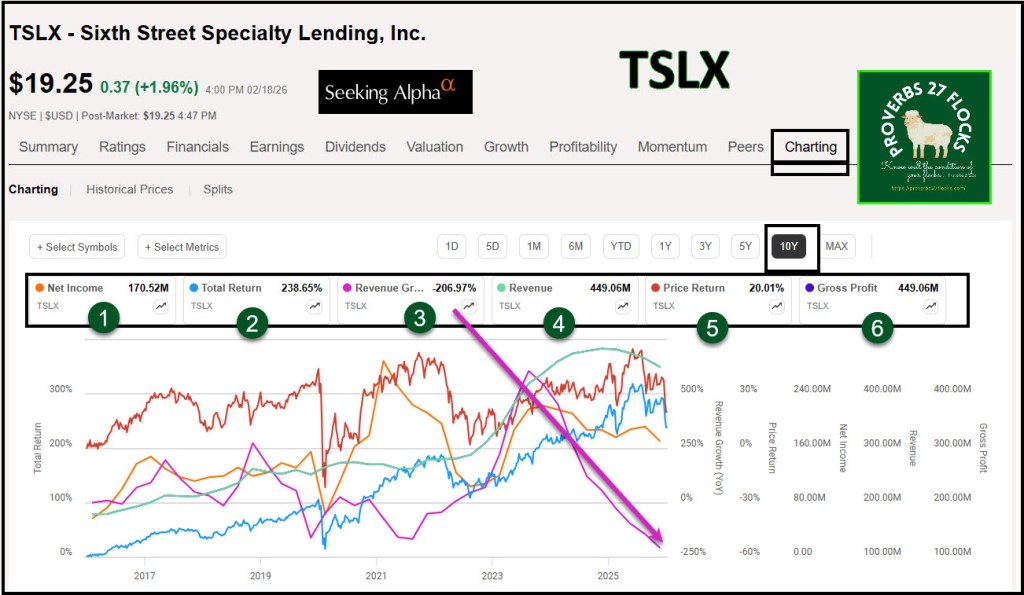
You can get too many pieces of data and that can cloud your ability to see the investing road. What is best, I believe, is to choose some key factors to measure the potential for investing success. These might include Net Income (TTM), Total Return, Revenue Growth, Total Revenue (TTM), Price Return, and Gross Profit.
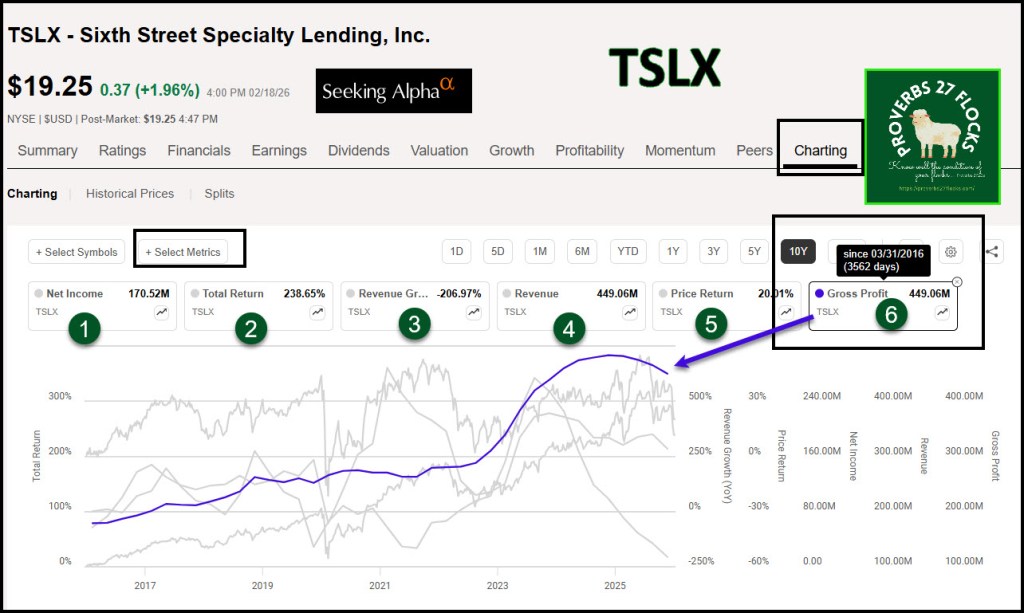
When you are using the charting tool you can select the metrics you want to chart.
Why is Net Income an important measure for investors?
Net income is a crucial measure for investors as it reflects a company’s profitability after all expenses, taxes, and costs have been deducted from total revenue. This metric provides insights into the financial health and operational efficiency of a business.
Key Reasons Why Net Income Matters
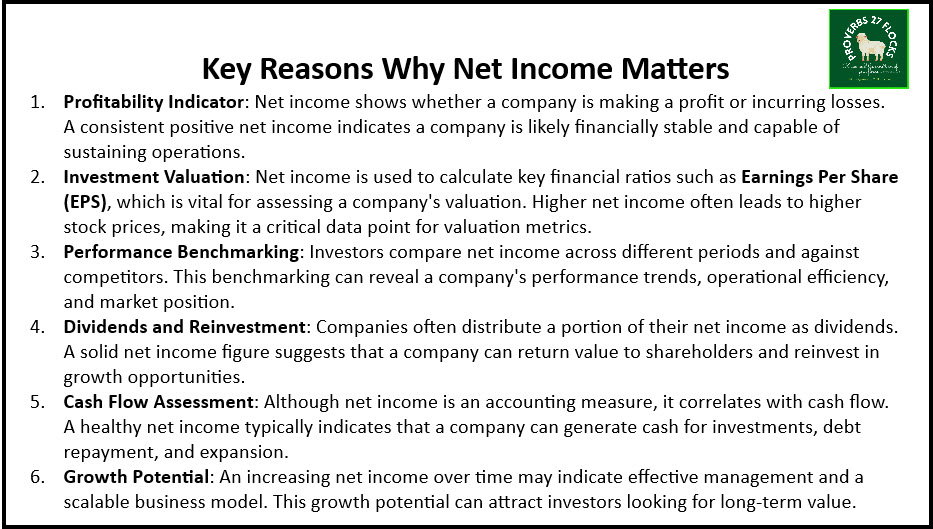
- Profitability Indicator: Net income shows whether a company is making a profit or incurring losses. A consistent positive net income indicates a company is likely financially stable and capable of sustaining operations.
- Investment Valuation: Net income is used to calculate key financial ratios such as Earnings Per Share (EPS), which is vital for assessing a company’s valuation. Higher net income often leads to higher stock prices, making it a critical data point for valuation metrics.
- Performance Benchmarking: Investors compare net income across different periods and against competitors. This benchmarking can reveal a company’s performance trends, operational efficiency, and market position.
- Dividends and Reinvestment: Companies often distribute a portion of their net income as dividends. A solid net income figure suggests that a company can return value to shareholders and reinvest in growth opportunities.
- Cash Flow Assessment: Although net income is an accounting measure, it correlates with cash flow. A healthy net income typically indicates that a company can generate cash for investments, debt repayment, and expansion.
- Growth Potential: An increasing net income over time may indicate effective management and a scalable business model. This growth potential can attract investors looking for long-term value.
Why is Revenue Growth an important measure for investors?
Importance of Revenue Growth for Investors
Revenue growth measures the increase in a company’s sales over a specific period. It is a critical indicator of a company’s performance and overall health, reflecting its ability to expand its business and gain market share.
Key Reasons Why Revenue Growth Matters
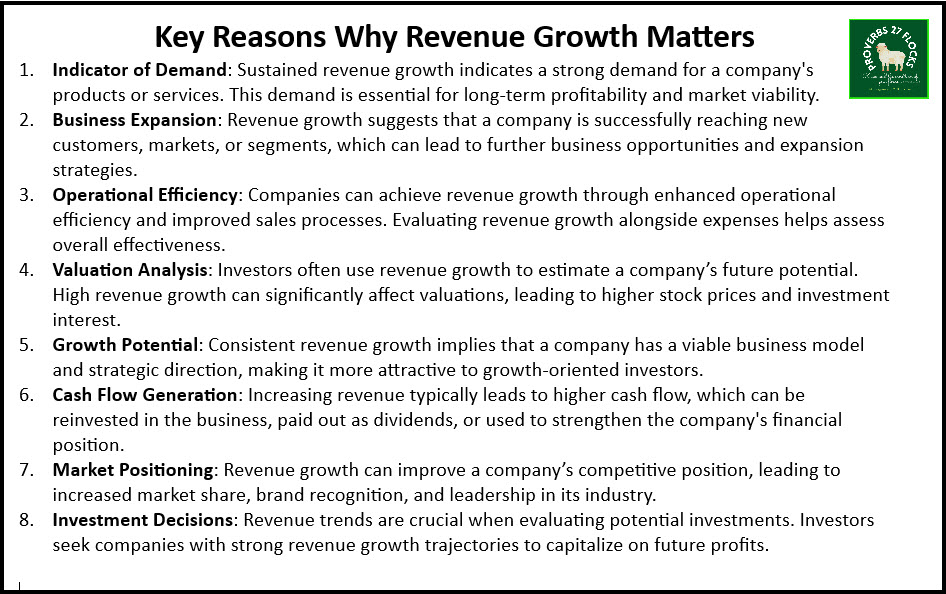
- Indicator of Demand: Sustained revenue growth indicates a strong demand for a company’s products or services. This demand is essential for long-term profitability and market viability.
- Business Expansion: Revenue growth suggests that a company is successfully reaching new customers, markets, or segments, which can lead to further business opportunities and expansion strategies.
- Operational Efficiency: Companies can achieve revenue growth through enhanced operational efficiency and improved sales processes. Evaluating revenue growth alongside expenses helps assess overall effectiveness.
- Valuation Analysis: Investors often use revenue growth to estimate a company’s future potential. High revenue growth can significantly affect valuations, leading to higher stock prices and investment interest.
- Growth Potential: Consistent revenue growth implies that a company has a viable business model and strategic direction, making it more attractive to growth-oriented investors.
- Cash Flow Generation: Increasing revenue typically leads to higher cash flow, which can be reinvested in the business, paid out as dividends, or used to strengthen the company’s financial position.
- Market Positioning: Revenue growth can improve a company’s competitive position, leading to increased market share, brand recognition, and leadership in its industry.
- Investment Decisions: Revenue trends are crucial when evaluating potential investments. Investors seek companies with strong revenue growth trajectories to capitalize on future profits.
Importance of Total Returns for Investors
Total returns represent the overall gain or loss on an investment, including both capital appreciation and income generated from the investment (such as dividends or interest). This measure is critical for investors as it provides a comprehensive view of an investment’s performance.
Seeking Alpha Charting Sample Links
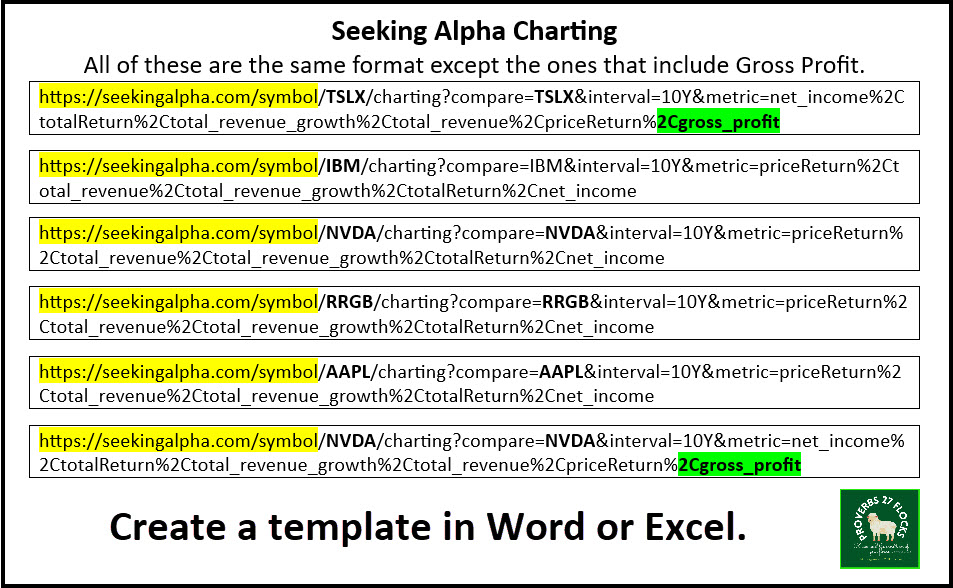
All of these are the same general format. Some include Gross Profit. You can copy links and change the ticker symbols to run the graphs for any investment. So, for example, the link for AAPL can be changed (in two places) to look at another stock like GOOG.
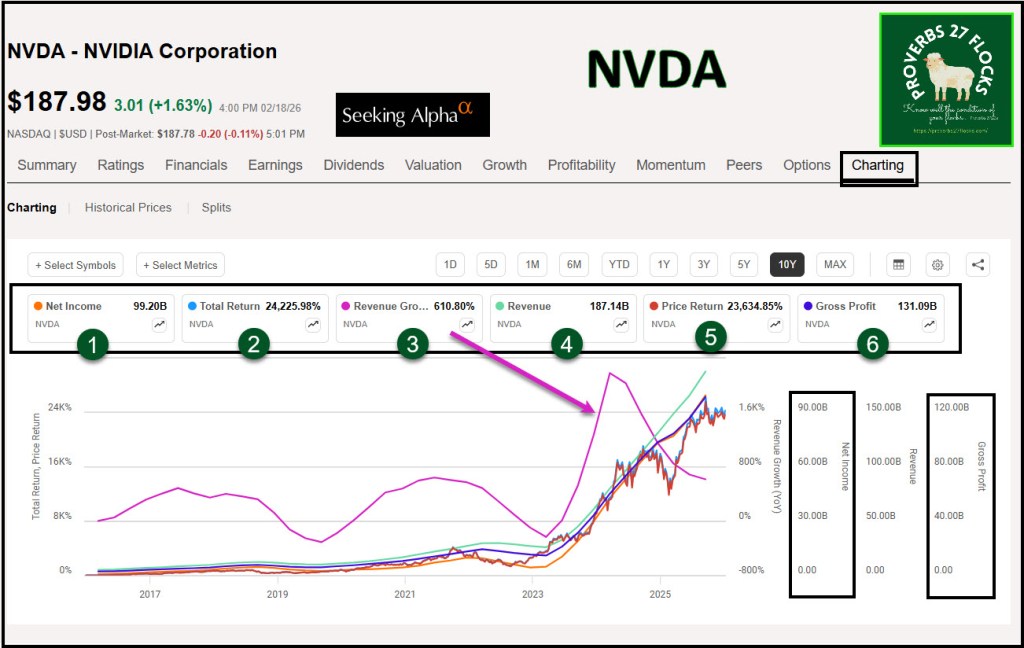
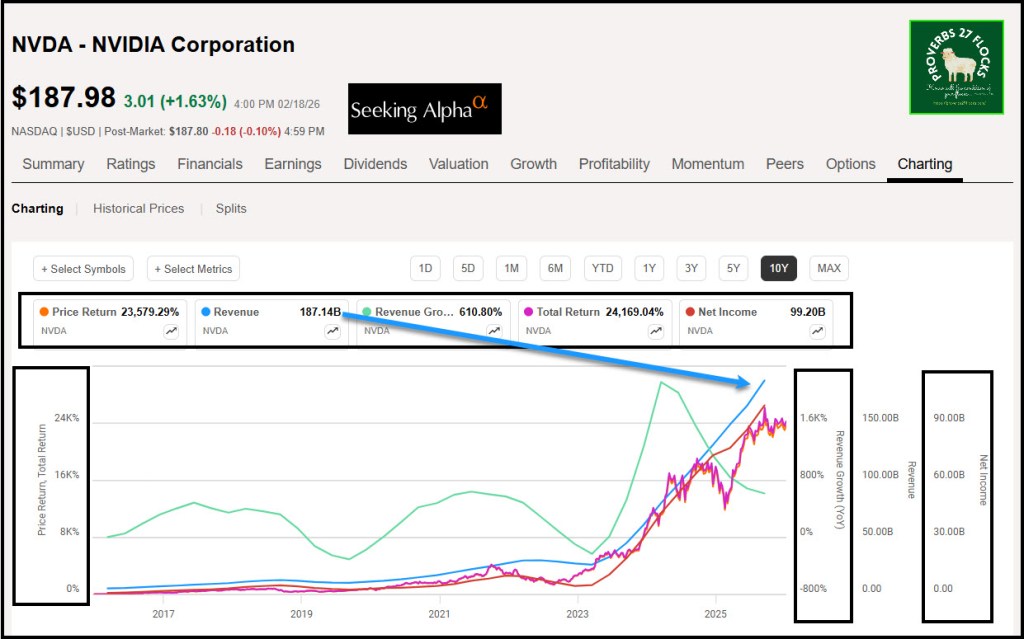
NVDA Chart without Gross Profit
Conclusion
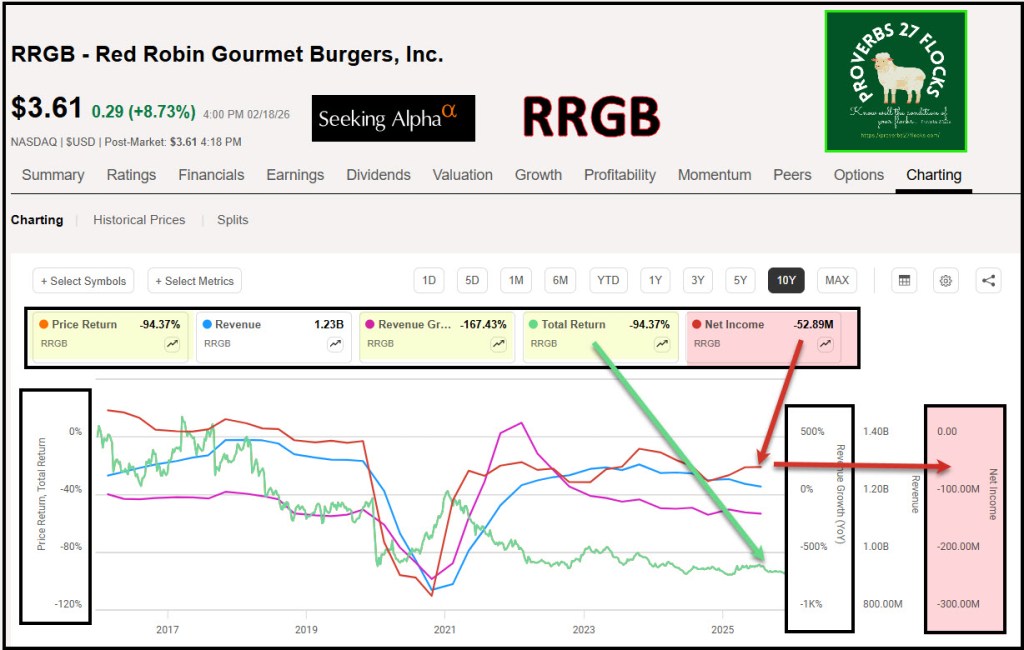
I believe RRGB (Red Robin Gourmet Burgers, Inc.) is an investment to avoid. RRGB’s QUANT rating is a HOLD, but that is probably an optimistic rating. The charts say “don’t buy RRGB.”
Seeking Alpha’s factor grades tell a helpful story that is confirmed by the graph. The current valuation is A+. The growth grade is B-. But more telling is the profitability “D”, the momentum D+, and the earnings revisions D+. Just because the valuation is great doesn’t mean the investment is.
Seeking Alpha Subscription Information
Of all of the resources I use, the most helpful is Seeking Alpha. If you decide to explore a Seeking Alpha subscription, please use the following link. Seeking Alpha

SEEKING ALPHA INFORMATION AND SUBSCRIPTION
You can also scan this QR Code to get the same information.

Past performance does not guarantee future results, Seeking Alpha does not provide personalized advice, and it is not a registered investment adviser.
We accept advertising compensation from companies that appear on our site. This website represents my opinions, which may not reflect those of Seeking Alpha, and does not constitute an investment recommendation or advice.
If you have any questions or problems getting connected to Seeking Alpha, reach out to them with this email address: subscriptions@seekingalpha.com
