

SA Summary Screen Continued
This is the second in “how does Wayne use Seeking Alpha to find good investments and avoid train wrecks?” The tool is not difficult to learn or to use. (What tools does your advisor use? Do they tell you what is in their own investment portfolios?) Perhaps you should look at your investments using Seeking Alpha to see if your advisor is doing a good job or not.

If you scroll down on the Summary page, one of the things you can see are the views of various Seeking Alpha authors and of Wall Street Analysts. (1 and 2) As you can see, they aren’t necessarily in agreement. The SA authors are more optimistic than the Wall Street folks.
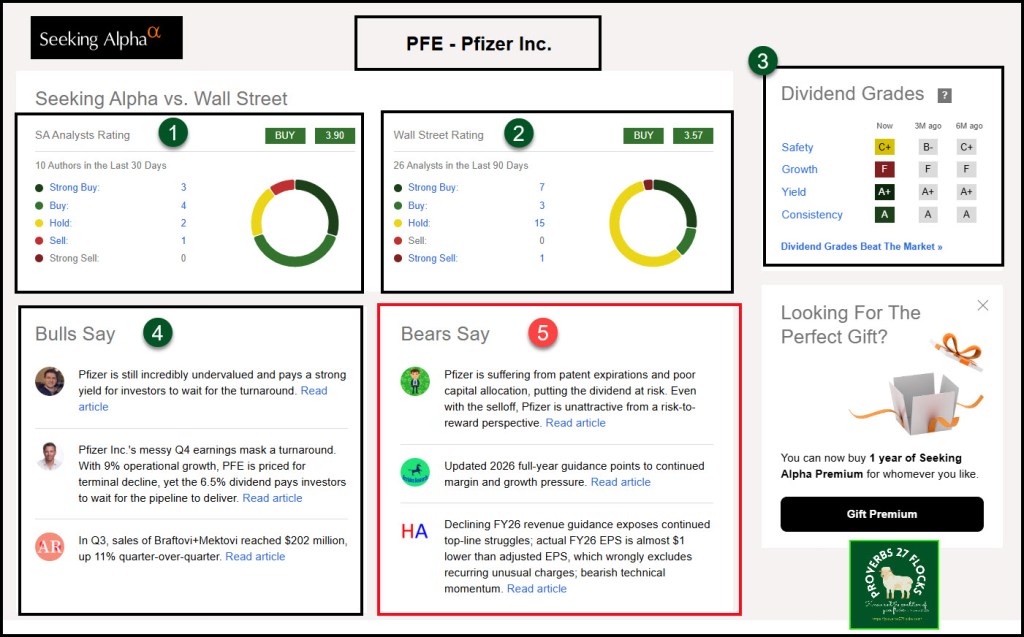
On the right side of the image you can see the “Dividend Grades.” If you are buying any investment that pays a dividend your expectation should be that you will be paid. In the case of Pfizer (3) the dividend growth grade is “D” but the “Yield” and “Consistency” are strong. In an ideal state, everything should be green or at least yellow.
It is also helpful to see what the optimist bulls (4) think about PFE, and what the pessimist (or realist) bears (5) are thinking. Bear in mind, however, that the SA QUANT rating is my first measure of the likely benefit of purchasing an ETF or stock.
Company Profile
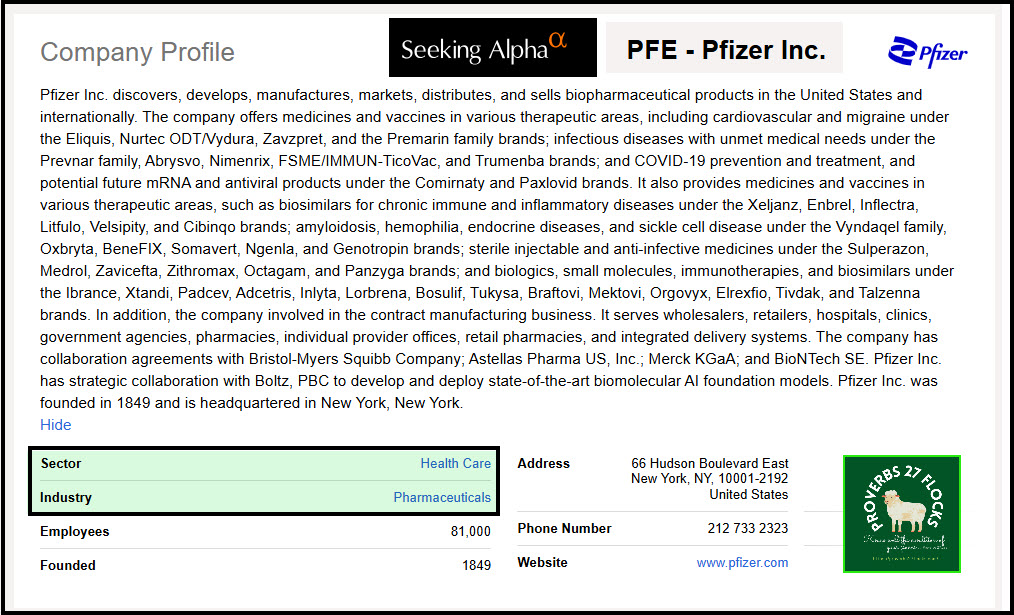
You should never buy an investment you don’t understand. Therefore, it is helpful to understand the size, purpose and focus of any investment. As you scroll down you will see a “Company Profile.” It is worth your time to read the information and to notice both the sector and the industry. For Pfizer these are “Health Care” and “Pharmaceuticals.” I tend to be in favor of health care, financial, real estate, and technology investments.
Revenue
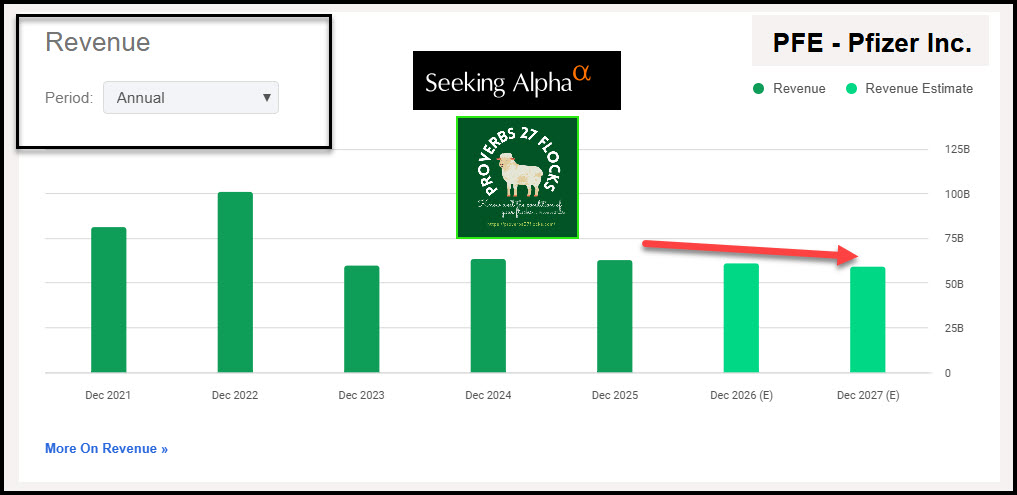
Further down on the summary page you can see a graph that shows revenue trends. Which direction is sales revenue going? Generally speaking, decreasing revenues is not an encouraging sign. However, this could turn quickly if Pfizer has a huge success.
Earnings Per Share
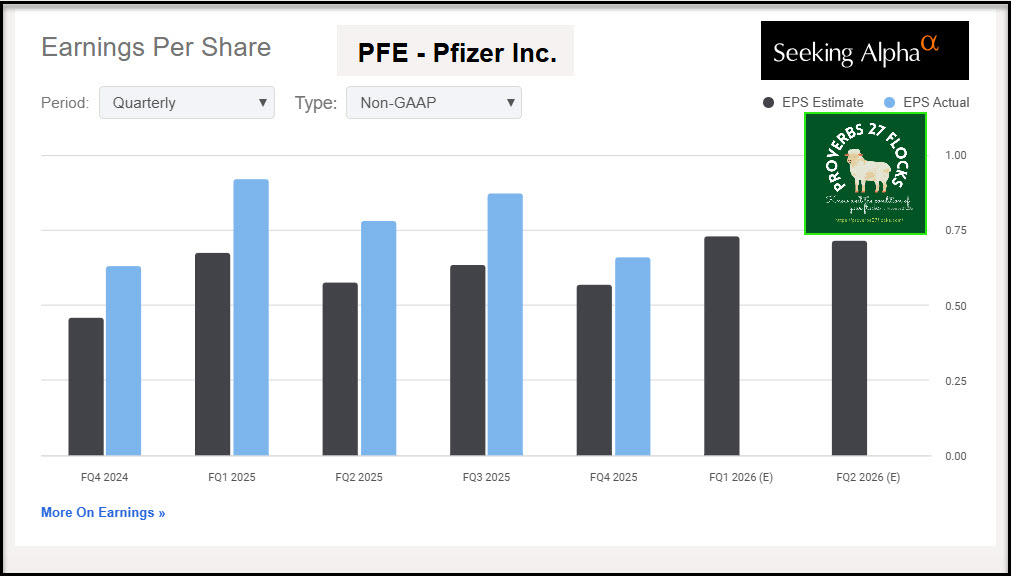
Just below Revenue is EPS. Some businesses are seasonal, so bear that in mind when you look at this graph. Also pay attention to the EPS “Estimate” and the EPS “Actual.” In the following illustration you can see the blue bars are taller than the black ones. This means the “analysts” tended to be more pessimistic about PFE than perhaps was warranted. Of course, pessimism and optimism are happening at the same time by various individual investors and analysts. In general, I like it when the blue is winning.
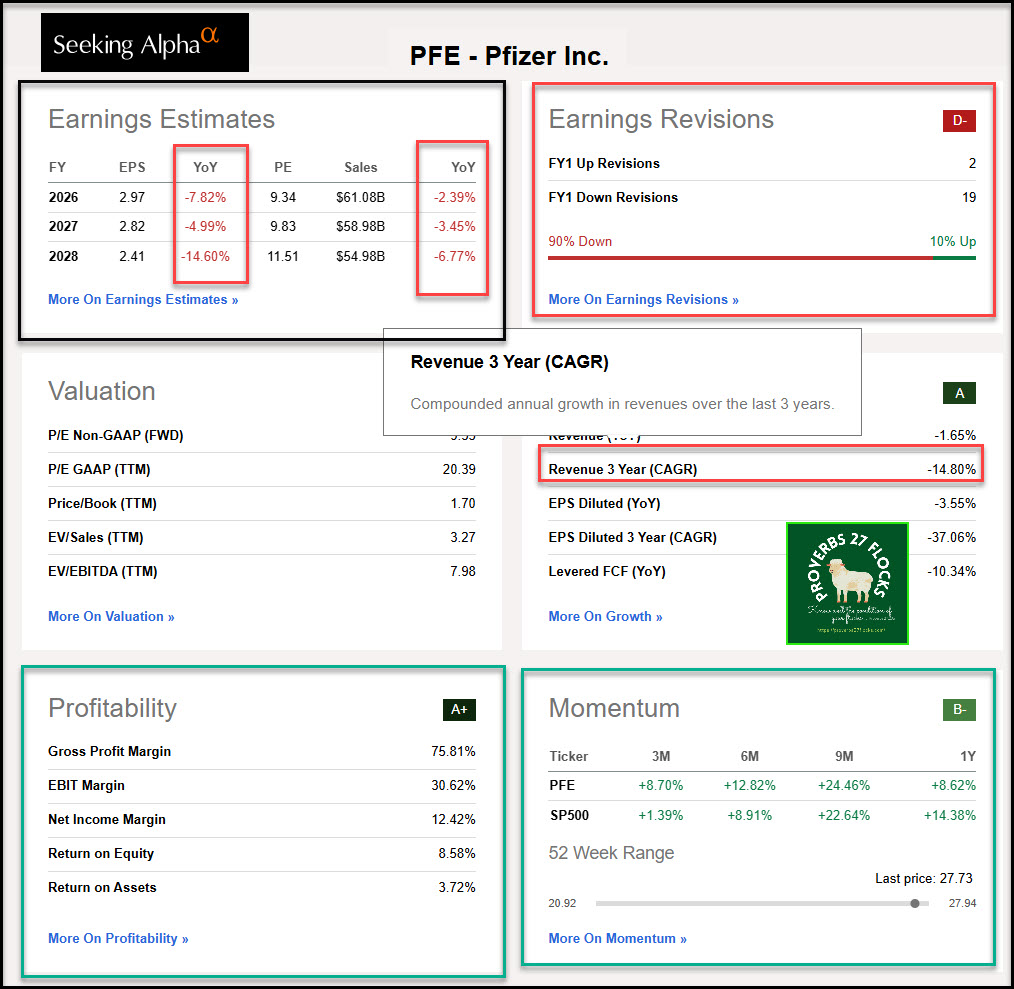
Earnings Estimates, Earnings Revisions and Valuation Metrics
Because I don’t want to spend too much time diving into the details I only glance at the next section. However, there are some alarms in this information. Earnings may not head in the right direction.
Capital Structure, Dividends and Trading Data
A company’s debt can be problematic. It is worth noting that PFE has $62B dollars in debt. That will scare off some investors. Dividends are always of interest to a dividend growth “easy income” investor. Pay attention to the “Payout Ratio.” If it is greater than 70% for most investments, that can be a warning flag.
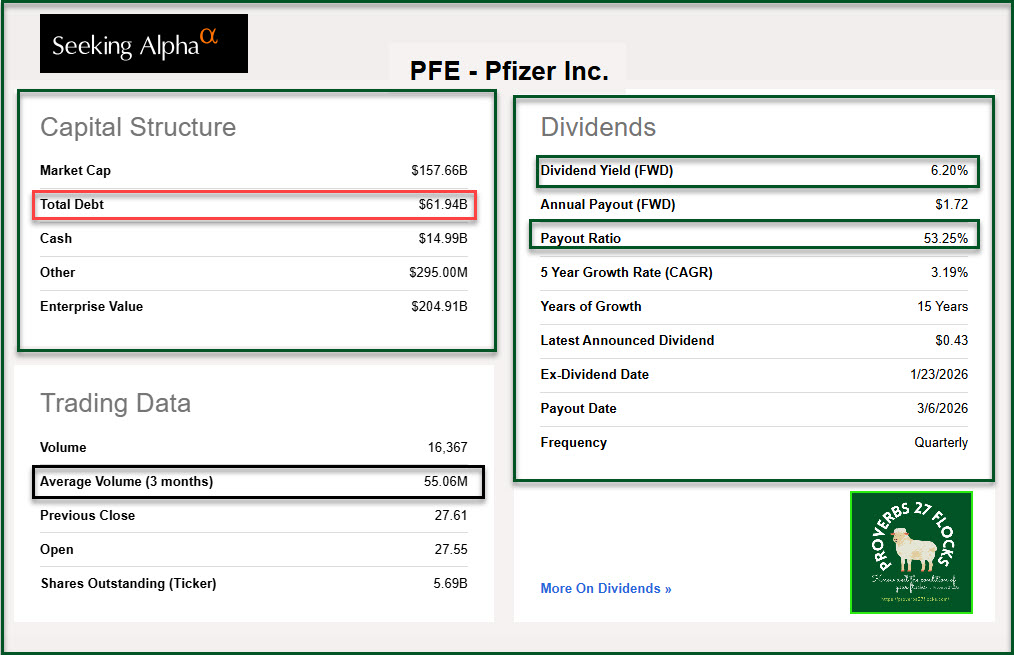
It is also wise to be aware of the trading volume. PFE has an average trading volume in the millions of shares. That means if you want to sell your shares there are many buyers.
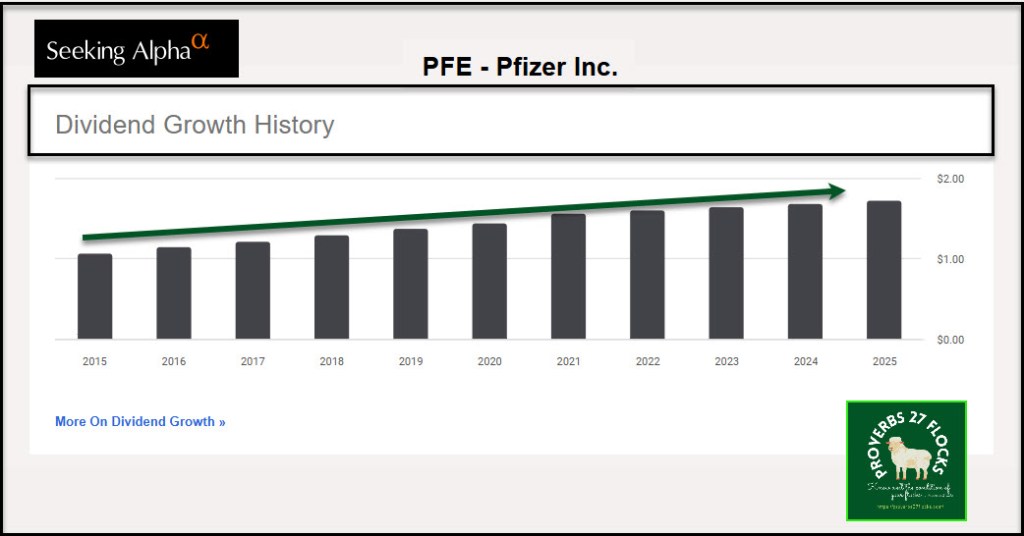
Dividend Growth History
The next image on the path down is the “Dividend Growth History.” Upwards is better than downwards.
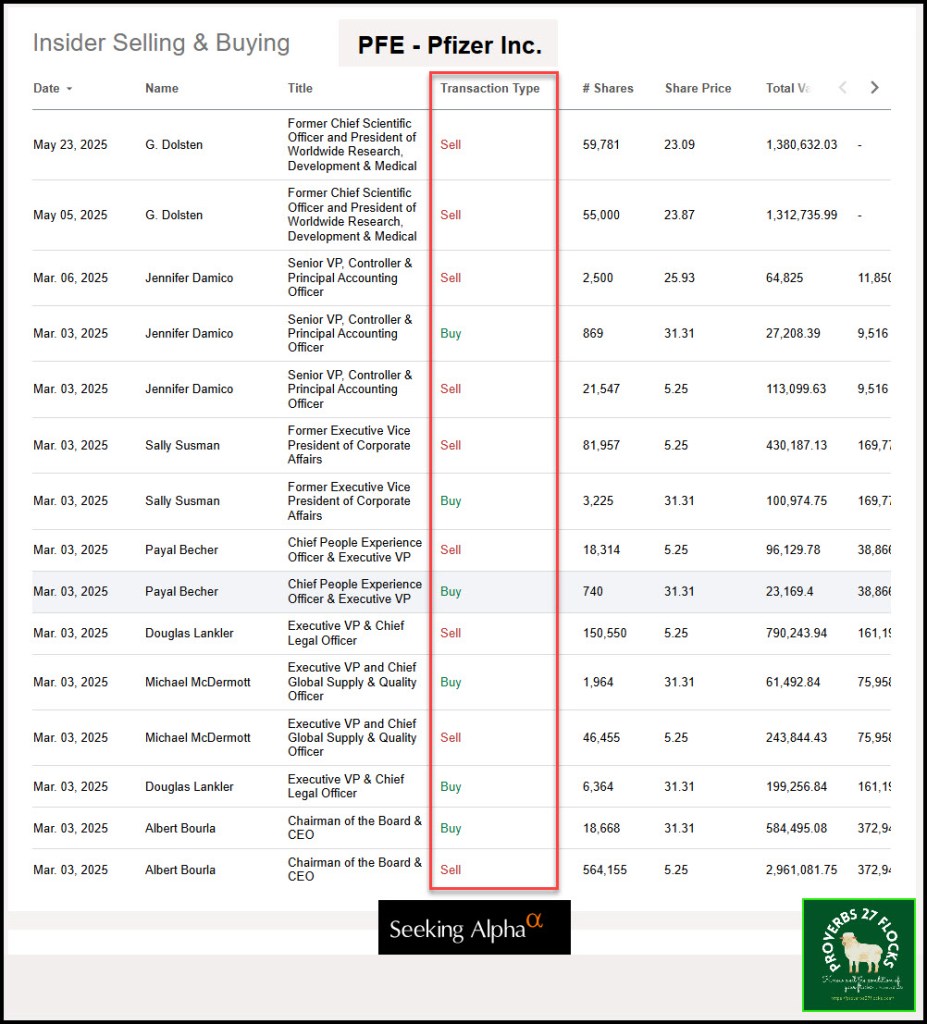
Insider Buying and Selling
Who do you think knows more about a business than the “insiders?” These are members of the executive team and the board of directors. While their behaviors to sell investments may be alarming, bear in mind that they might be selling to diversify their investment portfolio or to raise cash to buy land in Hawaii. Selling doesn’t mean a loss of confidence in the company’s future.
Summary of the Summary Page
The nice thing about the summary page is that most of the time I can quickly determine if an investment fits my criteria. Certainly if the QUANT rating is a “SELL” I usually won’t buy the investment.
Next Time
When someone asks me to recommend investments, I recommend investments I own. For the most part, my friends have been pleased with my recommendations. The next Seeking Alpha tool I will explain is the Portfolio view.
Seeking Alpha Subscription Information
Of all of the resources I use, the most helpful is Seeking Alpha. If you decide to explore a Seeking Alpha subscription, please use the following link. Seeking Alpha
This particular offer does have an expiration date.


SEEKING ALPHA INFORMATION AND SUBSCRIPTION
You can also scan this QR Code to get the same information.

Past performance does not guarantee future results, Seeking Alpha does not provide personalized advice, and it is not a registered investment adviser.
We accept advertising compensation from companies that appear on our site. This website represents my opinions, which may not reflect those of Seeking Alpha, and does not constitute an investment recommendation or advice.
If you have any questions or problems getting connected to Seeking Alpha, reach out to them with this email address: subscriptions@seekingalpha.com
