
Three Sources

The three places I review from time to time are Fidelity Investments, StockRover and Seeking Alpha. Fidelity gives me a quick look at total returns, StockRover, as I recently discovered offers a helpful view of future projected income and the sources of that income, and Seeking Alpha helps me understand the quality of our investment portfolio.
Fidelity Investments
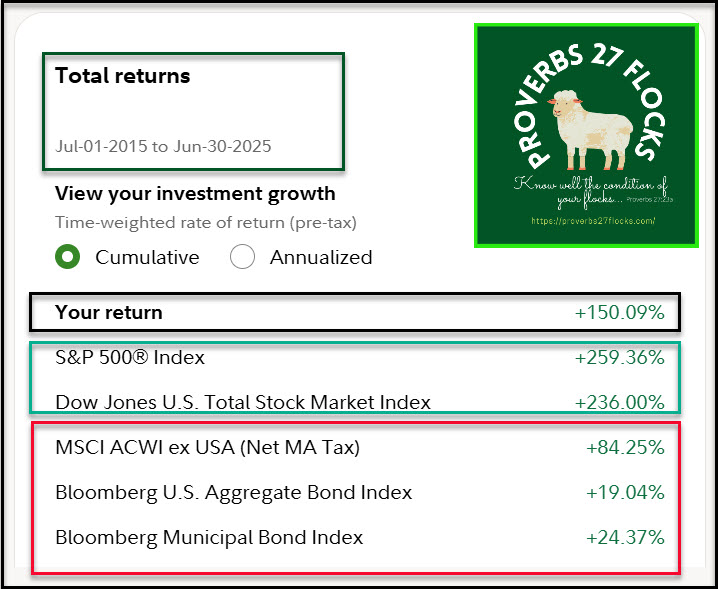
The best place to see the way your investment portfolio performs is to use the “More” dropdown in “All Accounts” and select “Performance.” The longer you are a Fidelity Customer, the more you can see your performance over time. My goal is not to beat the S&P 500 or even the total stock market returns. Part of the reason for this is that you cannot live off of “total returns.” However, I do want to beat the returns on bonds and on international stocks.
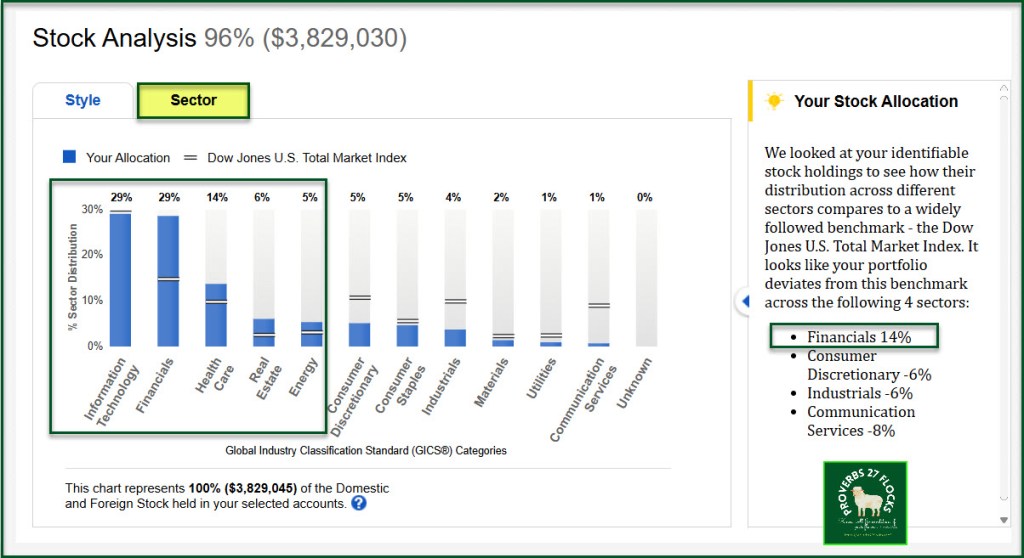
I also like to review the sector allocations. As you can see, I have heavy allocations in some sectors, including technology, financials, health care and real estate. I am light in consumer discretionary, industrials, utilities and communication services.
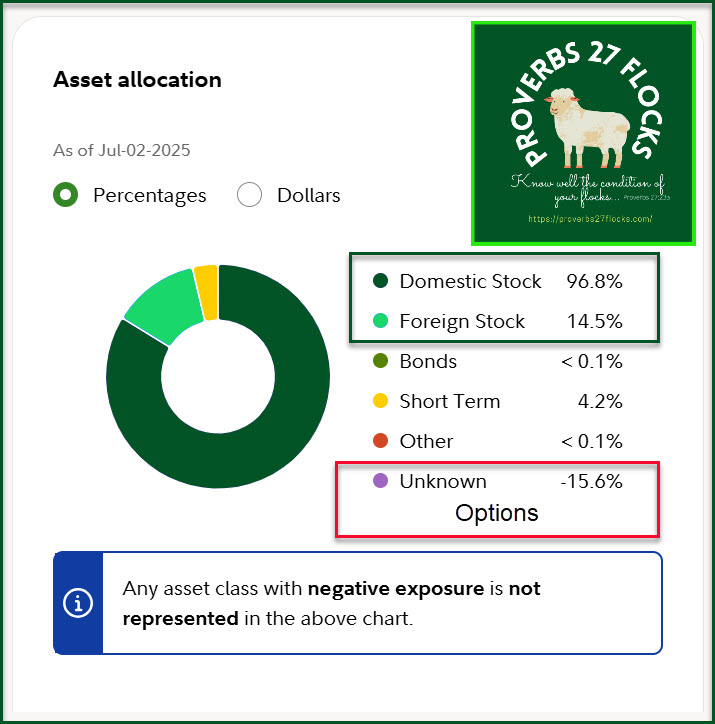
Overall asset allocation is the third important dynamic. It should be obvious that I prefer domestic (USA) stocks (and stock ETFs) and that I don’t think Bonds are a good idea.
StockRover
I also have a paid “Premium” subscription to StockRover. I paid $179.99 for the annual subscription in October 2024.
This tool provides helpful information about the quality of individual investments and some graphs that help illustrate the way dividends grow, or don’t grow for each stock or ETF I consider.
Someone recently asked me why I wasn’t using StockRover’s “Future Projected Income” tool. The reason is simple: I had not seen it in my travels on the StockRover website. However, here are two images that are most interesting and helpful. The first is a view of future income based on our current holdings. Based on June’s results, the graph appears to be fairly accurate.
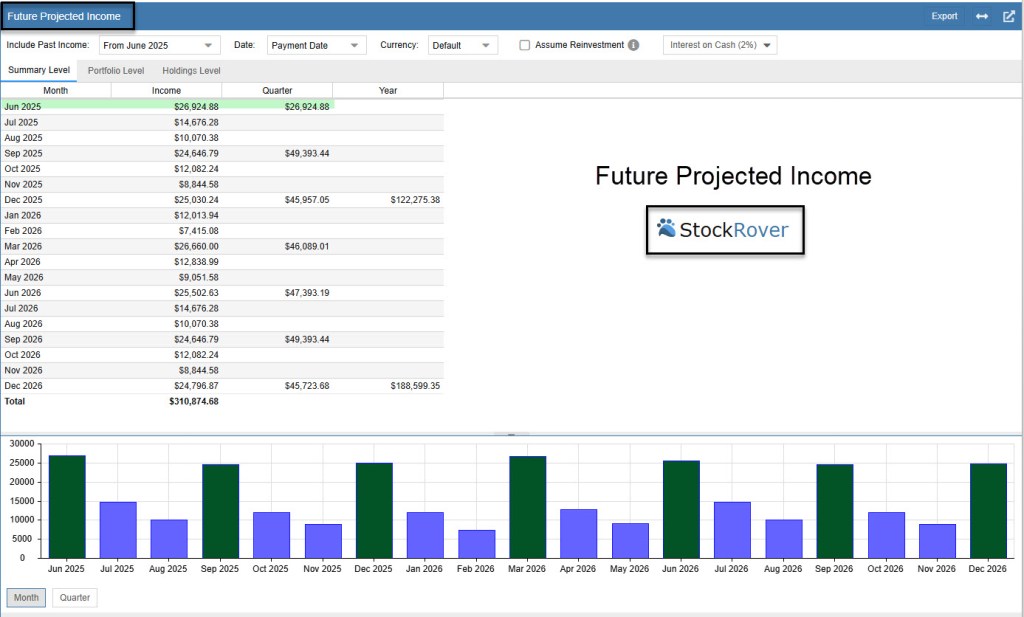
However, bear in mind that this graph cannot and does not reveal future income if dividends are increased, decrease, or suspended. It only tells you what you can expect based on the current dividend amounts of your current holdings. If you change your holdings or if dividends change the graph lacks value.
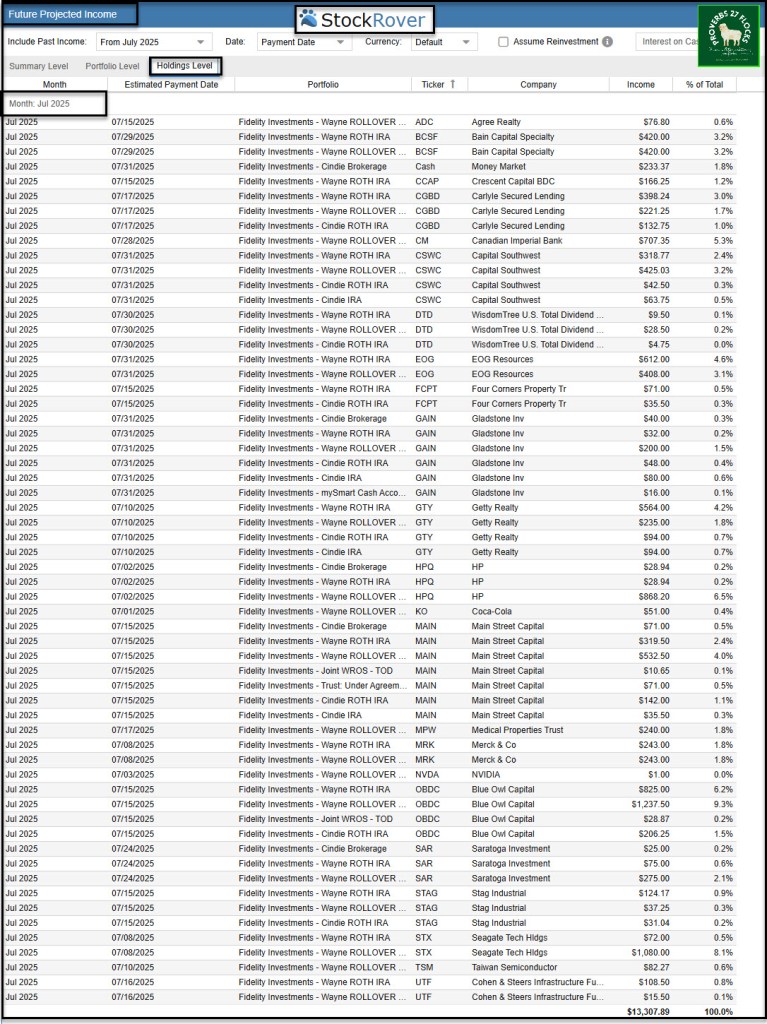
However it is possible to see what you can expect in dividends for each month. The following image shows what we can reasonably expect to receive in dividends for July 2025.
Seeking Alpha
I have a “Seeking Alpha Premium” plan. I purchased the current plan in July 2023, and I have been a subscriber since 2020. The plan I selected was a three-year plan, and the total cost of that plan was $393.68. That was a very good value. The next payment will be in July 2026 for $526.45. I have yet to find a financial advisor that will only charge me $175 per year to keep track of our $3.4M in portfolio assets. Some would like to charge us 1% each year, which would be over $34,000 per year.
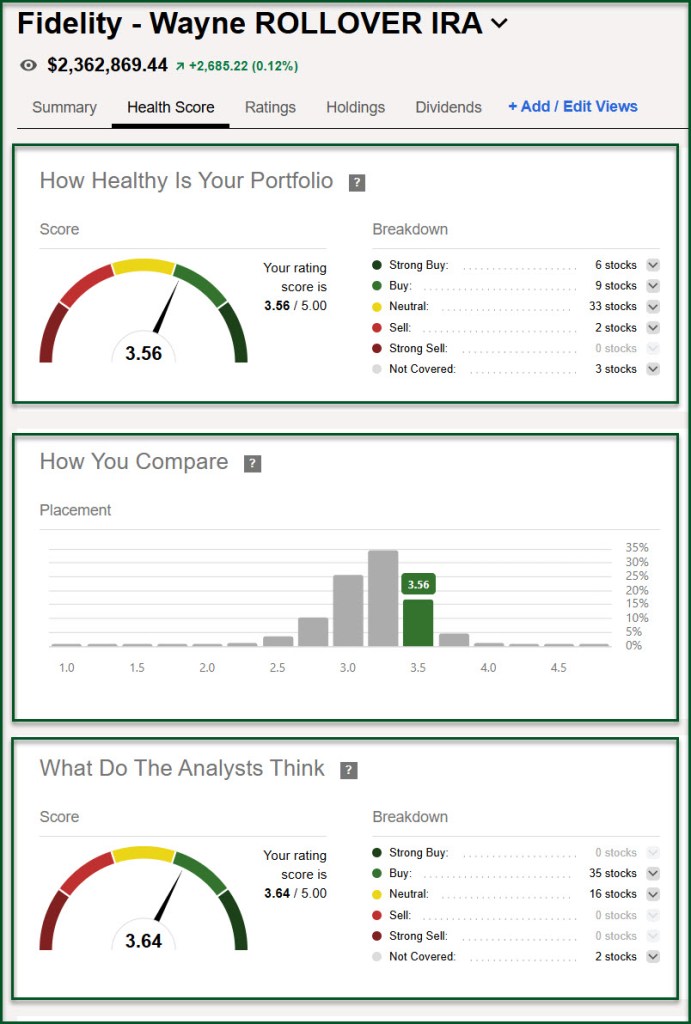
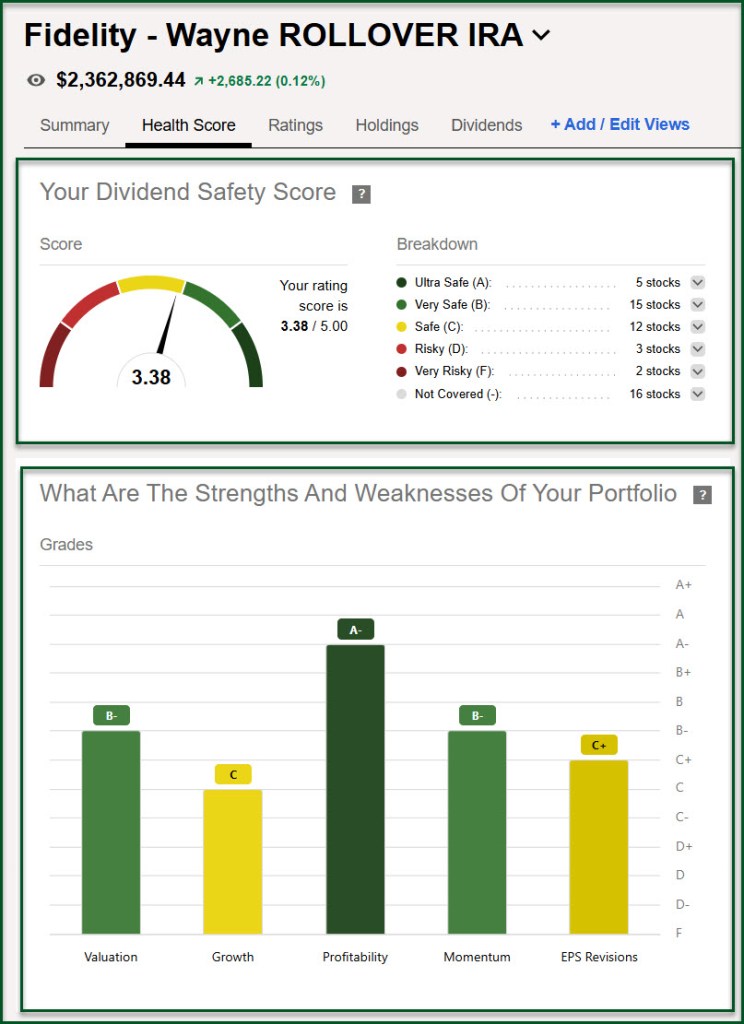
One of the ways I use Seeking Alpha is to see if there is quality in both our holdings and in our dividend paying investments. The following are taken from Seeking Alpha.
Seeking Alpha Subscription Information
Of all of the resources I use, the most helpful is Seeking Alpha. If you decide to explore a Seeking Alpha subscription, please use the following link. Seeking Alpha

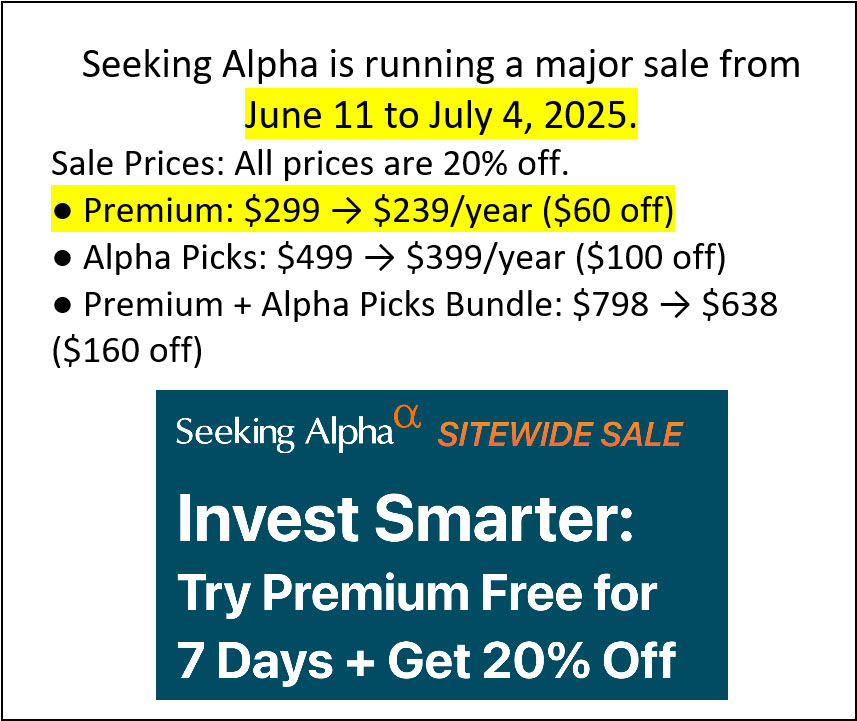
SEEKING ALPHA INFORMATION AND SUBSCRIPTION
You can also scan this QR Code to get the same information.

Past performance does not guarantee future results, Seeking Alpha does not provide personalized advice, and it is not a registered investment adviser.
We accept advertising compensation from companies that appear on our site. This website represents my opinions, which may not reflect those of Seeking Alpha, and does not constitute an investment recommendation or advice.
