

It Isn’t That Difficult

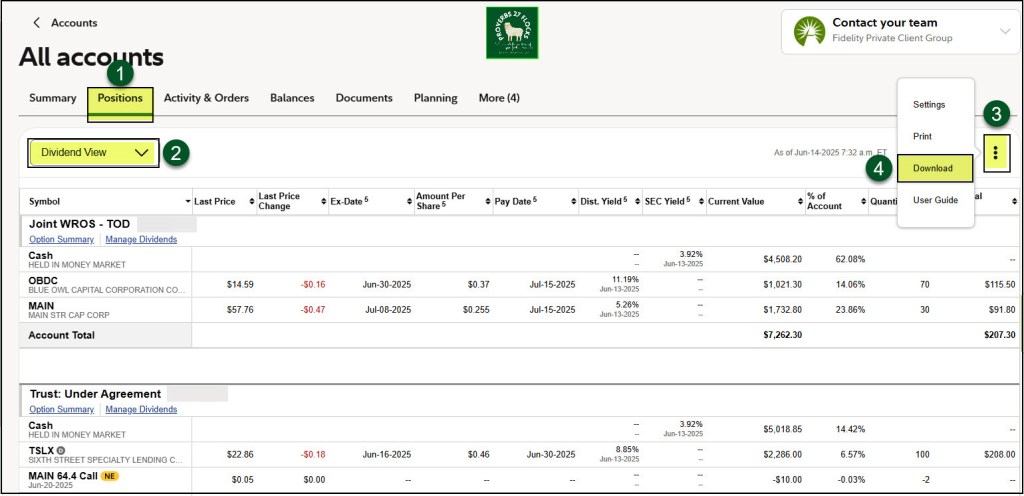
In my previous post I acknowledged the easiest way to get a picture of your dividend income in the future is to use your Fidelity Investments statements. You can also see estimated income at any time by logging into your account, going to POSITIONS, and then by changing the dropdown from OVERVIEW to “DIVIDEND VIEW.” The EAI (Estimated Annual Income) will appear at the far right of the window.
I don’t know if other brokers offer the same capabilities. When I have helped others I have not seen anything as robust as what Fidelity has to offer in this regard.
Downloading Your Positions
You can also download your positions to a CSV file to import your positions data into a spreadsheet. If you start with POSITIONS and then change the dropdown from OVERVIEW to “DIVIDEND VIEW,” you should see three vertical dots on the far right as shown below. Click on those dots and then select “Download.” The downloaded file can be stored in a special folder or you can just keep it in your default download folder.
Open the CSV File
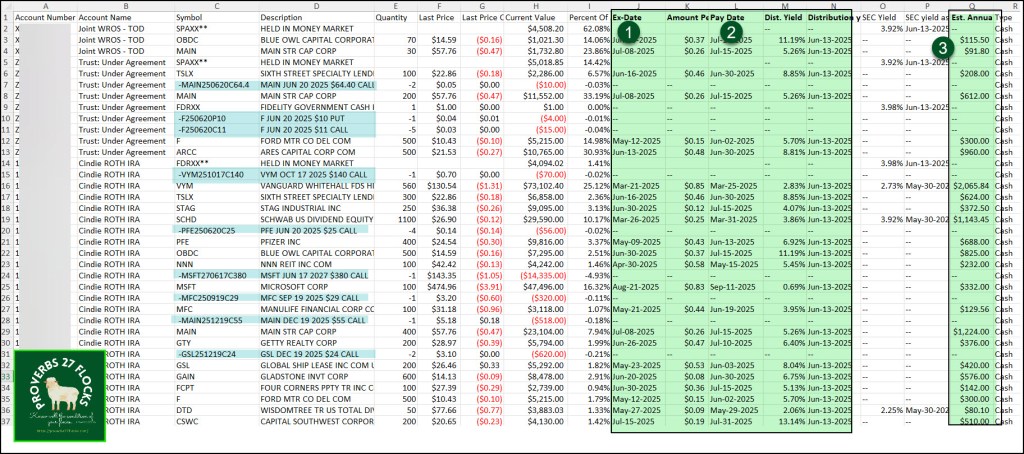
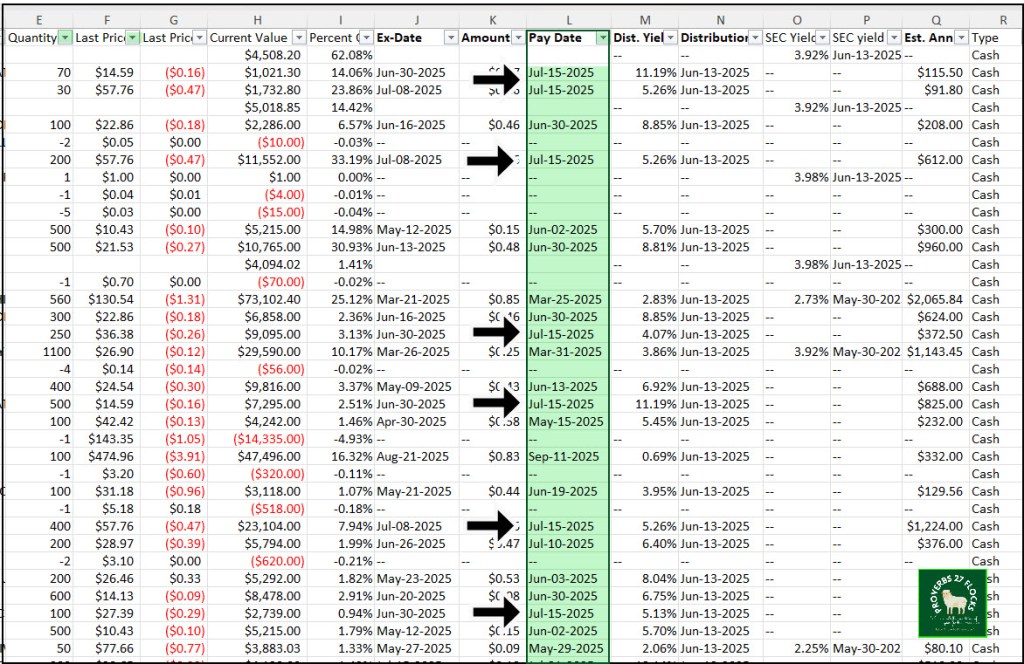
If you have Excel, the easiest way to open the CSV file is to double-click on the file. If you use Excel’s “File Open” function you will have to make some formatting decisions. I don’t bother with that. The following image shows the columns of interest to me. They are the Ex-Dividend Date, the dividend Amount Per Share, the dividend Pay Date, the Yield, the Distribution yield as of Date, and the Estimated Annual Income. The fields of primary importance are three: Ex-Dividend Date, Pay Date, and the EAI. For example, TSLX will pay their dividend on June 30, and for the account in question our EAI is $208. For ARCC the dividend will be paid on the same day, and the EAI is $960 for that account.
Don’t Lose Your Work
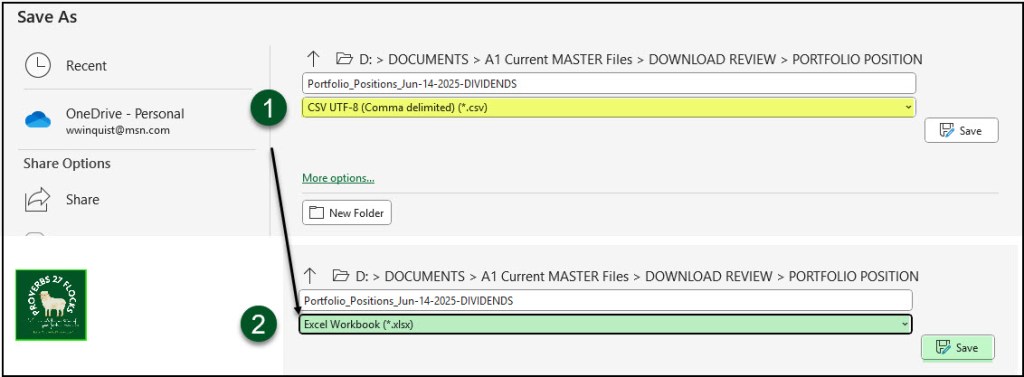
Unless you change the filetype early in the process, you won’t save any formatting you do in Excel. Therefore, before you go too far, do a File, Save As. Change the filetype from “CSV UTF-8” to “Excel Workbook.” Then click SAVE.
Turn On Filters
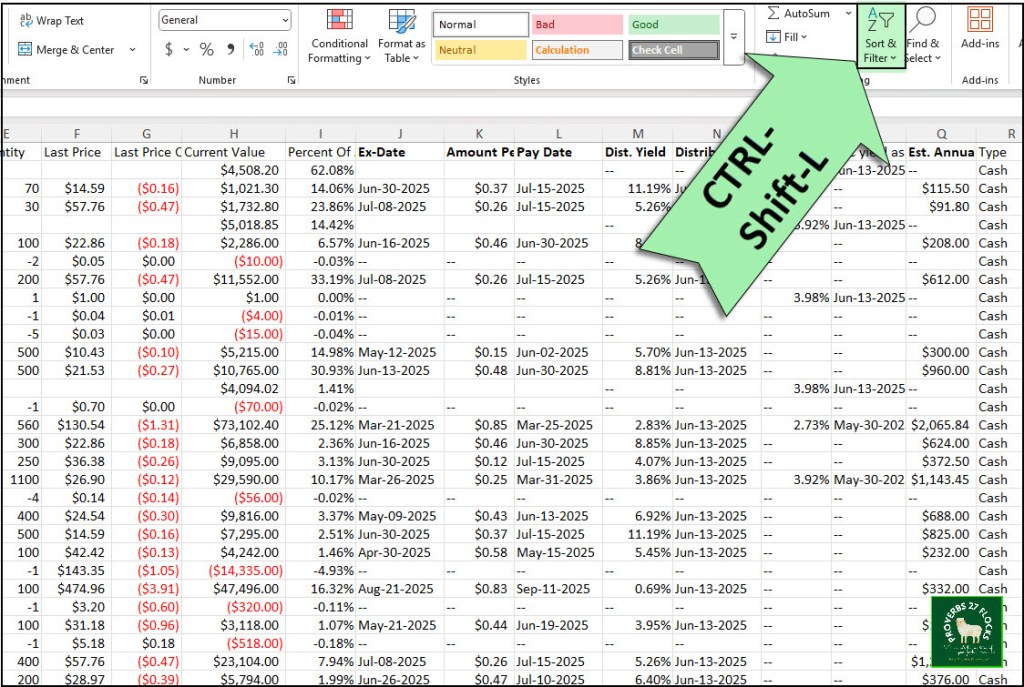
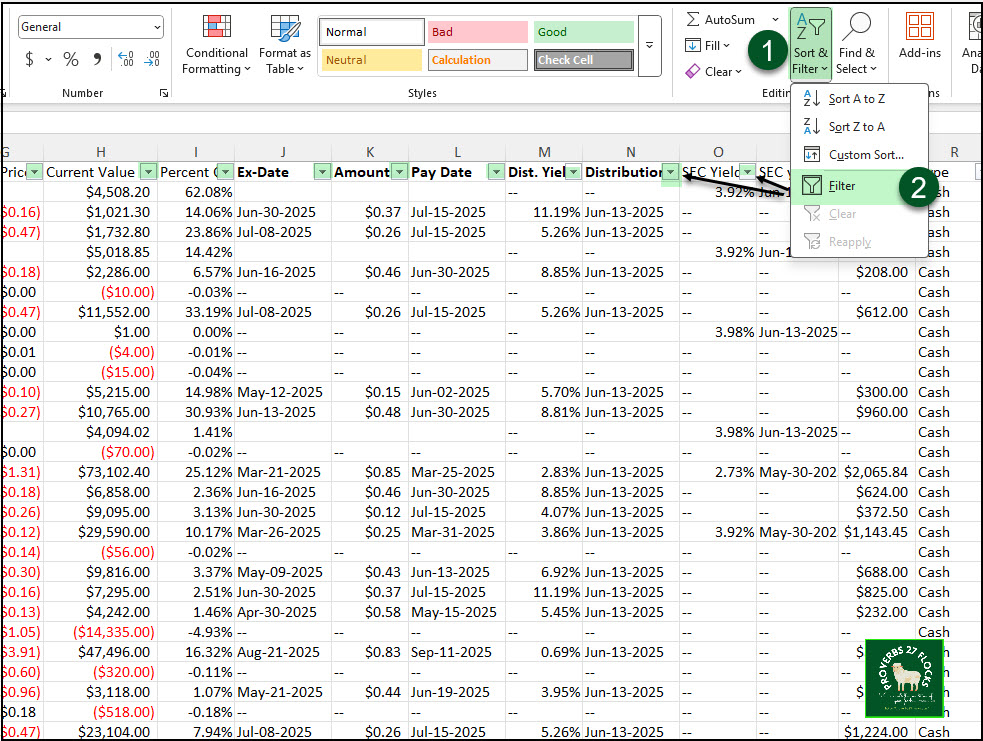
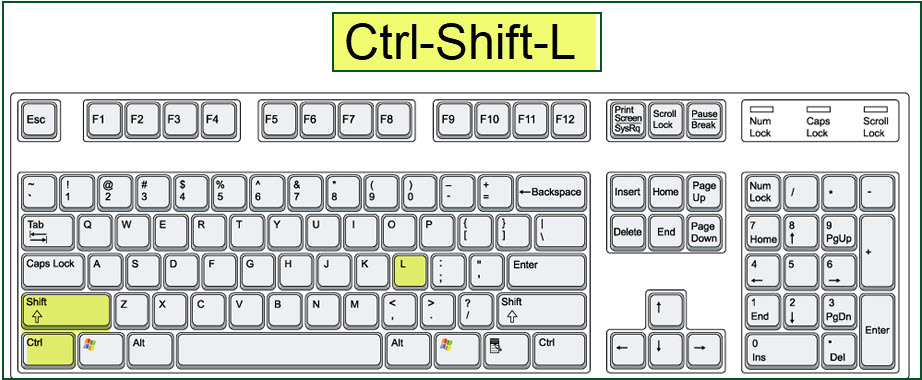
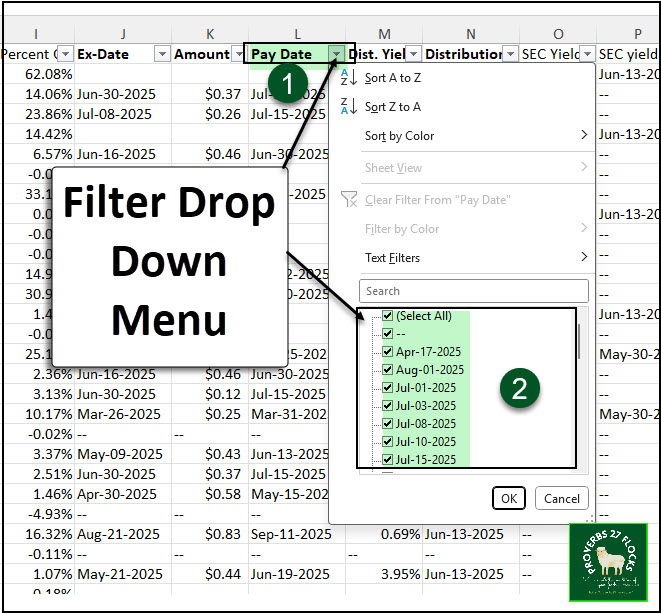
Now the fun can begin. You can filter your data to see the information that is important to you. There are two ways to do this. One is to use the dropdown menu for “Sort & Filter”, but you can accomplish the same thing using Ctrl-Shift-L. If you use the dropdown menu, just select “Filter.” You will know filters are on when you see little dropdown arrows at the top of each column.
Filtering on Dividend Pay Date
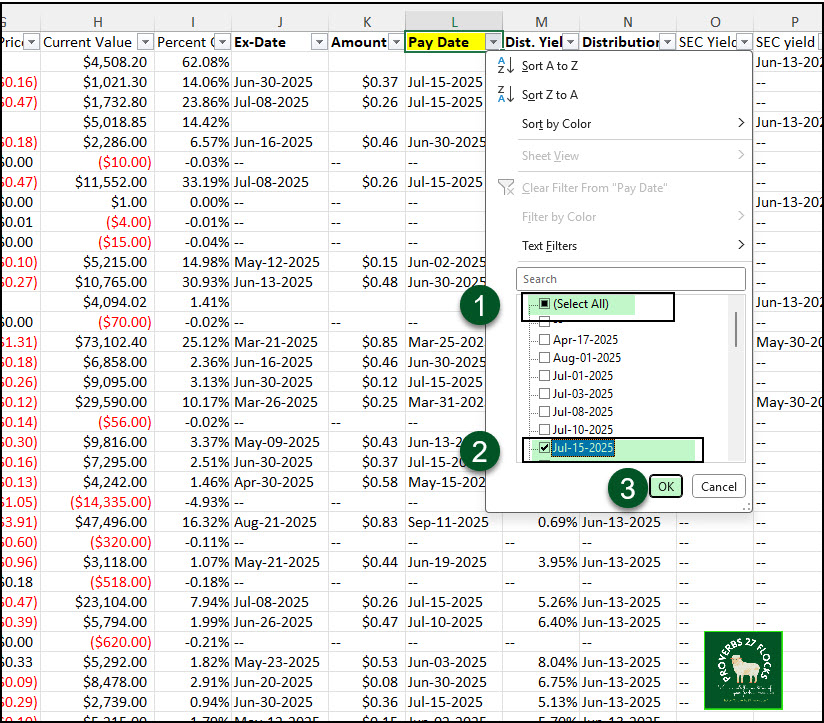
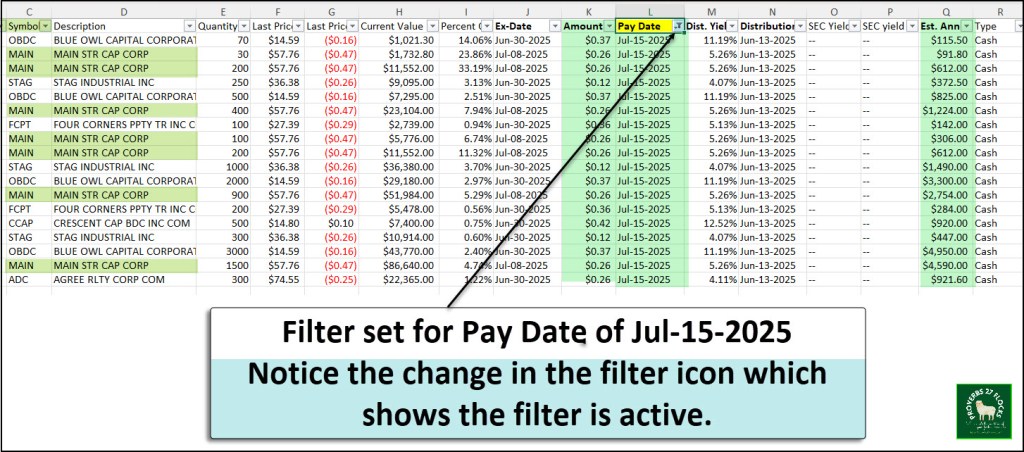
When you click on the filter arrow at the top of the “Pay Date” column you can choose which date or dates you want to see. For example, assume that you are interested in the dividends that will be paid on July 15. You can click on (Select All) to unselect all dates, and then click on Jul-15-2025 to see only the dividends to be paid on that date. When you do this, the little icon at the top of the column reminds you that you are filtering on this column. I could also add a second filter to the Symbol column to see just one holding like “MAIN” or “STAG.” This is helpful because MAIN is one of our top ten holdings.
Covered Call Options
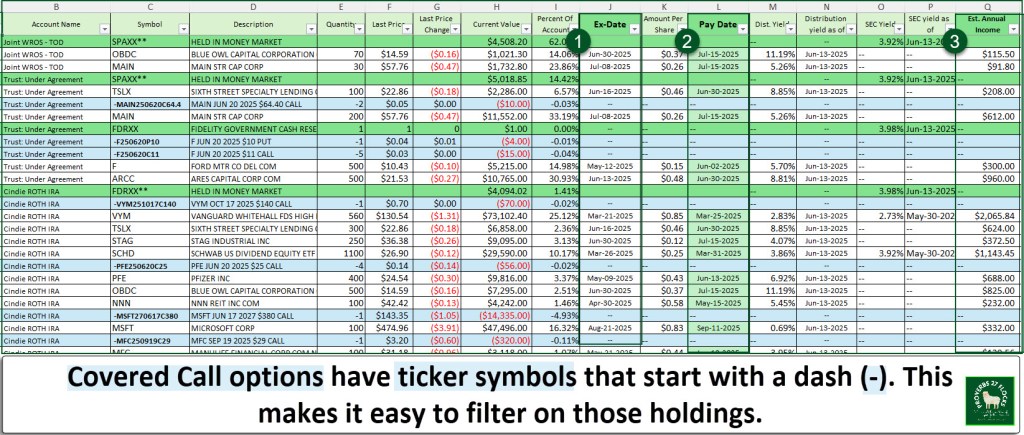
My download includes our Covered Call Options holdings. Those are shown in blue on the following image. Note that options do not pay dividends. Rather, you received income from selling your covered all. You will still receive your dividends for your holdings when the option is open, so trading options just adds some “synthetic dividend” income to your mix. If you don’t want to see positions that don’t pay a dividend, then use the “Est. Annual Income” filter to deselect the “- -“ amounts. You can do this on any column that shows the double dash, not just the EAI column.
In Summary
Once you master this part, you can then become even more creative and visual using Excel’s Pivot Table and Charting Capabilities. Being able to filter data helps you see important pieces of your portfolio, especially if you have more than one account.
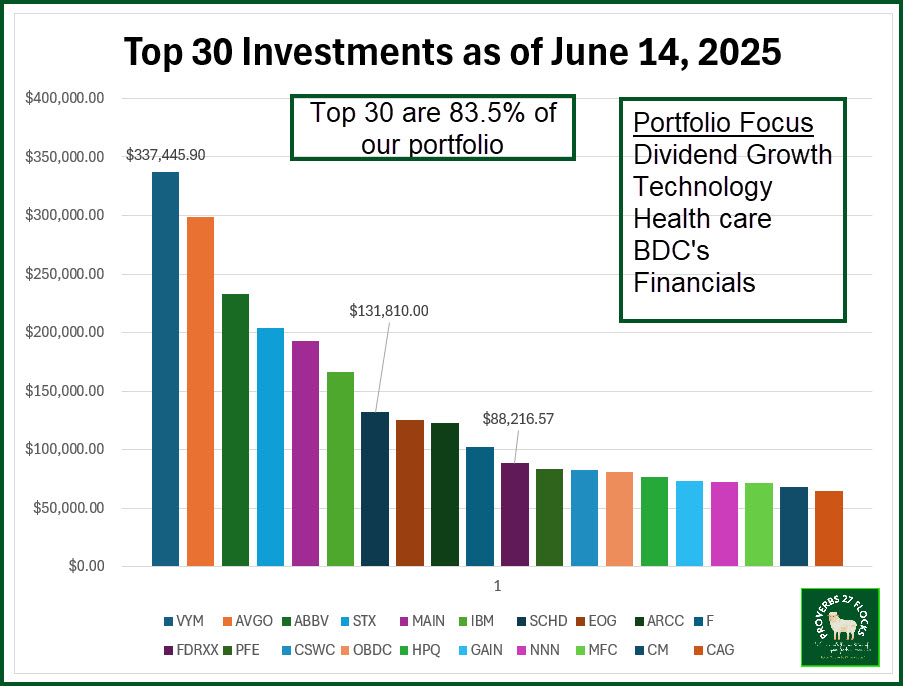
The following image was created in Excel using filters, a pivot table, and then a chart. This tells a story about our top thirty holdings and how much we have invested in each position across all of our accounts.
Seeking Alpha Subscription Information
Of all of the resources I use, the most helpful is Seeking Alpha. If you decide to explore a Seeking Alpha subscription, please use the following link. Seeking Alpha

If you link your Seeking Alpha account to your brokerage account, you can also download CSV files from Seeking Alpha for even deeper analysis by QUANT rating or dividend growth.
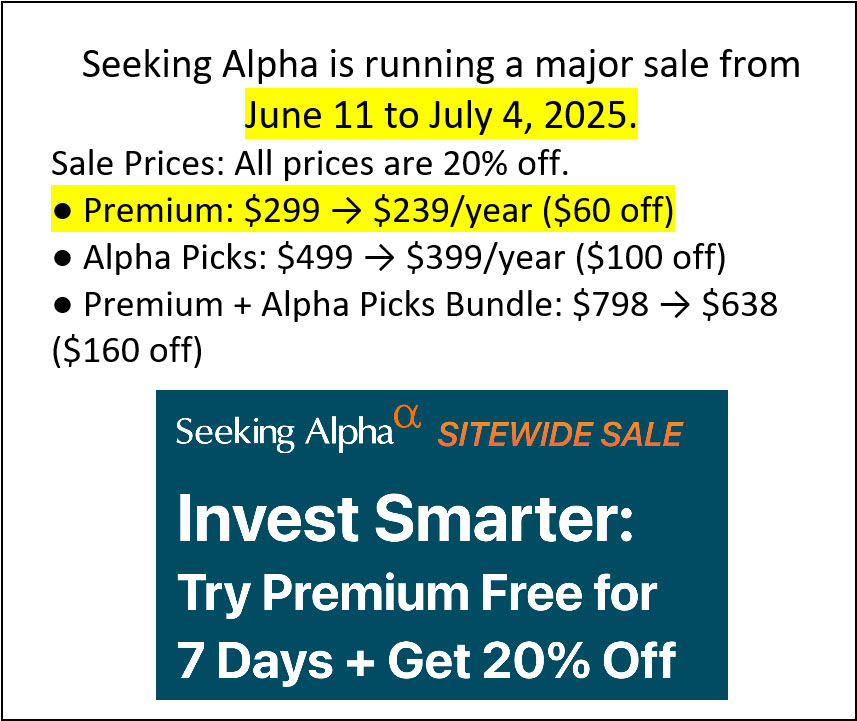
Seeking Alpha is running a major sale from June 11 to July 4, 2025. Sale Prices: All prices are 20% off.
Premium: $299 → $239/year ($60 off) – this is the one I use
Alpha Picks: $499 → $399/year ($100 off)
Premium + Alpha Picks Bundle: $798 → $638 ($160 off)
SEEKING ALPHA INFORMATION AND SUBSCRIPTION
You can also scan this QR Code to get the same information.

Past performance does not guarantee future results, Seeking Alpha does not provide personalized advice, and it is not a registered investment adviser.
We accept advertising compensation from companies that appear on our site. This website represents my opinions, which may not reflect those of Seeking Alpha, and does not constitute an investment recommendation or advice.

Why not use the Future Income feature in Stock Rover?
LikeLiked by 1 person
StockRover’s future income is another way to look at income. I wasn’t aware of that functionality, and quickly reviewed it. The downside is that I assume you have to have a SR subscription for you to fully use things like the future income feature. Most of my readers don’t have that tool.
LikeLike