
How Can You Know?
I often refer to this proverb: “Know well the condition of your flocks, and give attention to your herds, for riches do not last forever; and does a crown endure to all generations?” Proverbs 27:23-24

The reason is quite simple. People who own sheep want them to do several things. They want them to be healthy so that they will reproduce, grow to maturity, provide wool, and perhaps even provide meat for the dinner table. Sheep that are not healthy are a liability, not an asset.
The same is true of your investments. You should figuratively walk through your investment herd. How many sheep do you have? Are they bearing lambs? Are the producing wool you can take to the market? This can be difficult unless you have a good tool to help you “take the temperature” of your flock.
Two Great Tools – What I Want to See
There are at least two ways to analyze the health of your investment portfolio using Seeking Alpha. Because my traditional IRA is my largest account, I did an IRA health checkup using Seeking Alpha. Here are four graphs for the first high-level flock analysis.
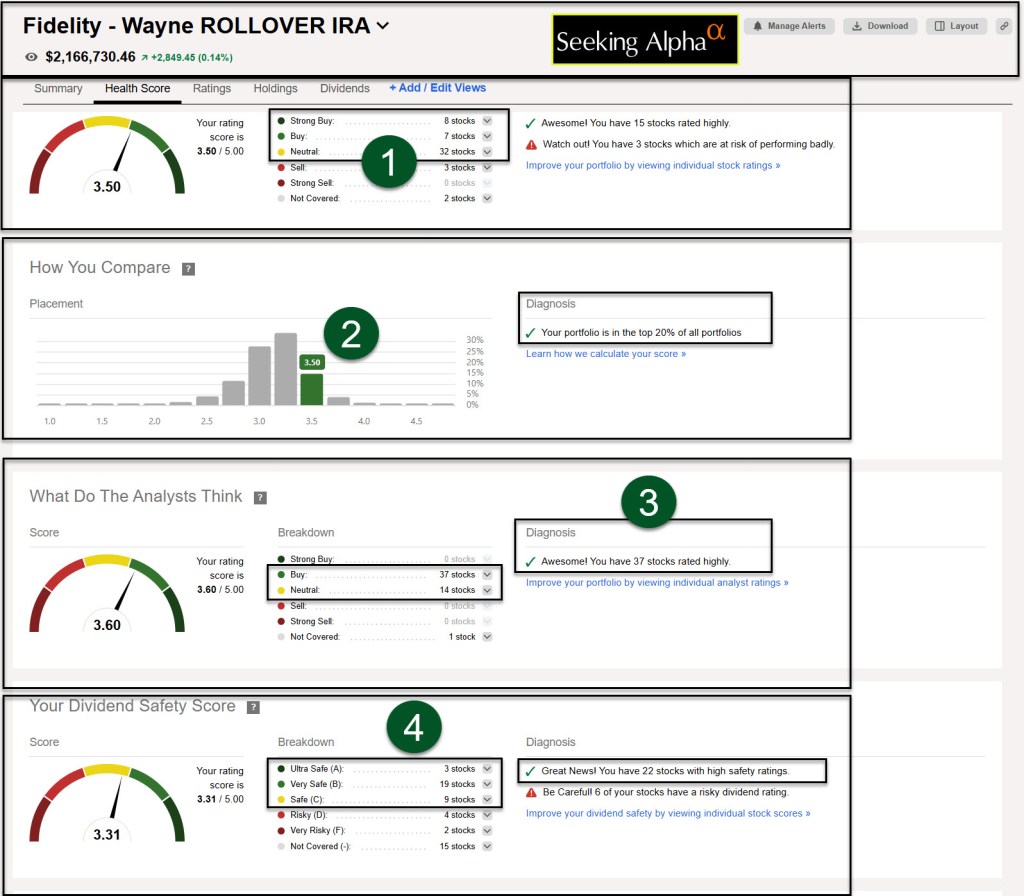
Health Score (Graph 1)
The first indicator is the “Health Score.” While a “Strong Buy” or “Buy” rating is not a guarantee of future success, it is a helpful look at true current risk based on the metrics used in Seeking Alpha’s QUANT rating. However, a caution is worth mentioning. Just because something is a “Strong Buy” doesn’t mean everyone should load up on that investment. Furthermore, just because an investment is a “Neutral” doesn’t mean I won’t buy more of that investment. This is just an overall high-level view of the IRA.
How You Compare (Graph 2)
Again, this rating might make you proud or self-satisfied. Comparisons can lead you to make wrong conclusions. Having said that, I don’t want to be “average” as an investor and I don’t feel compelled to try to overthink getting above the 20% comparison with other investors. Lets face it, it is likely that Seeking Alpha clients are more astute than others, so those in the top 50% are just a bit better than many investors based on what I have seen.
What Do the Analysts Think? (Graph 3)
I’d rather align myself with the Seeking Alpha analysts than the Wall Street analysts. Wall Street has a hidden agenda to make a profit on their recommendations. That can be very short-sighted. Having said that, there are Seeking Alpha analysts that have investment philosophies that I don’t care to emulate.
Your Dividend Safety Score (Graph 4)
This is probably the most important factor for a dividend growth investor. As you can see, I own investments with dividend safety scores that are “Risky” or “Very Risky.” Furthermore, I have dividend-paying investments that do not have safety scores. Ford, for example, is a higher risk when it comes to their dividend. This has happened in the past when Ford suspended their dividend. For that reason I don’t think many investors who read my blog should buy Ford shares without understanding the risks. Ford, on the other hand, is a good beginner’s stock for trading covered call options.
Linking Your Account to Seeking Alpha
To get this view I have to have a Seeking Alpha subscription. I also have to be willing to link my Fidelity Investments accounts to Seeking Alpha. That makes many people nervous. However, the technology being used for the linking is not easily compromised, so I am comfortable with the link to gain the advantages of easy portfolio analysis.
You can get some good analysis by creating your own “portfolio” manually as well, but if you have a lot of positions this can be cumbersome and time-consuming. For example, I created a “portfolio” that contains only our REIT positions. This helps me quickly see the QUANT ratings for all of the REITs we own.
Wayne’s IRA Dividend Details
In addition to the summary information from the portfolio checkup, it is possible to download data from Seeking Alpha to make it easier to see the strengths and weaknesses of the dividend-paying investments. There are a few weaknesses in this tool. For example, the “Est Annual Income” is underreported for the ETFs. It was immediately obvious to me that VYM’s dividend for an entire year, based on the number of shares I own, is far more than $680 per year. I suspect the other ETFs (highlighted in blue in the first column) are also underreported.
As you can see in this table, Ford (F) has a dividend safety rating of “F.” The other investments with red safety ratings are BDCs. These investments can be volatile when the economy gets into trouble. You will see evidence of this in the “Years of Growth” and in the “Consecutive Years” the dividends have been paid.
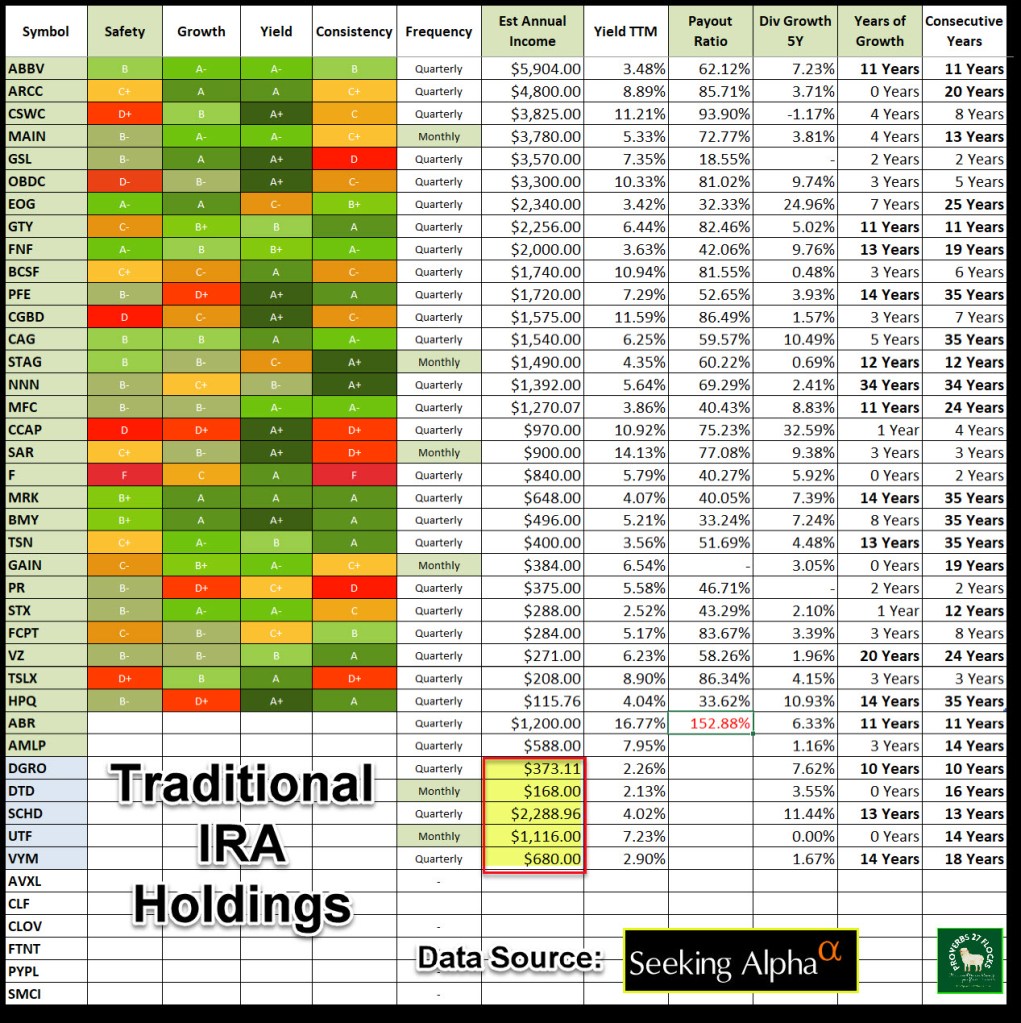
In general, look for green ratings for investments. That won’t prevent you from getting burned from time-to-time, but it will greatly reduce the burn from first-degree to third-degree.
The “Estimated Annual Income” for my traditional IRA is far more than the total shown by Seeking Alpha. It is better to use the numbers provided by Fidelity Investments for this metric. However, even Fidelity’s EAI numbers are lacking because of the way they handle dividend-paying investments in their model.
Seeking Alpha Subscription Information
Of all of the resources I use, the most helpful is Seeking Alpha. If you decide to explore a Seeking Alpha subscription, please use the following link. Seeking Alpha

SEEKING ALPHA INFORMATION AND SUBSCRIPTION
You can also scan this QR Code to get the same information.

Past performance does not guarantee future results, Seeking Alpha does not provide personalized advice, and it is not a registered investment adviser.
We accept advertising compensation from companies that appear on our site. This website represents my opinions, which may not reflect those of Seeking Alpha, and does not constitute an investment recommendation or advice.
