
A Reader’s Question
In my previous post about percentages, one reader asked the following question: “Where do you get the 5-year dividend growth rate…is it calculated or is this data available from somewhere else?”
The Quick Answer First
The quick answer is that I use Seeking Alpha. There are a couple of reasons for this, but the primary reason is that I like the way Seeking Alpha presents the data that I want to see. (I hope to join the Seeking Alpha Affiliate program, so if you are interested, I will let you know when that happens.)
The Other Sources
Having said that, there are two other sources I use. One is Fidelity Investments, and the other is Stock Rover. Each offers some helpful information, but I would rank Fidelity Investments as my third pick after Seeking Alpha and Stock Rover.
Three Important Percentages
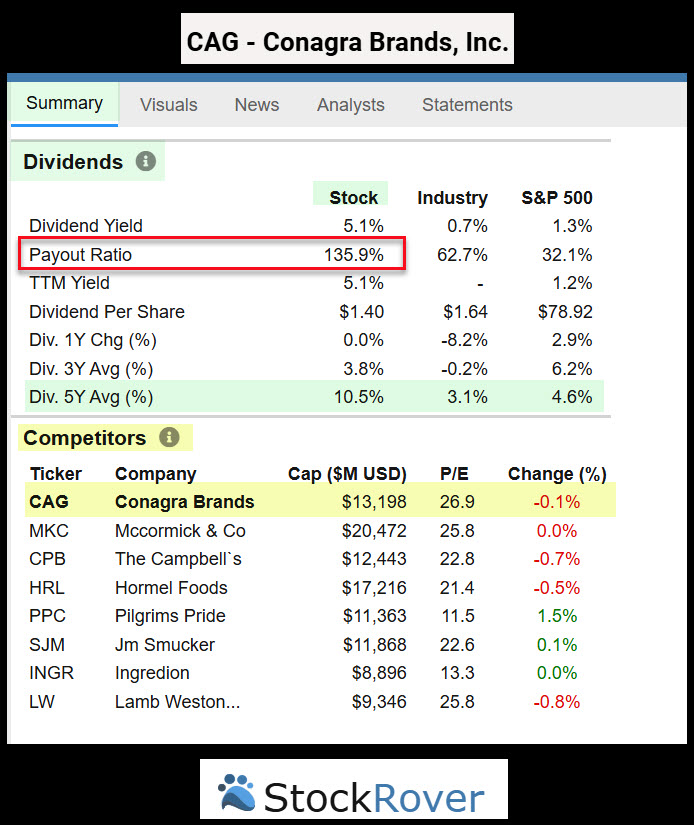
When it comes to percentages, three key values jump out at me. The first is the dividend yield. While this is the least important indicator, I prefer investments that have a yield greater than 2%
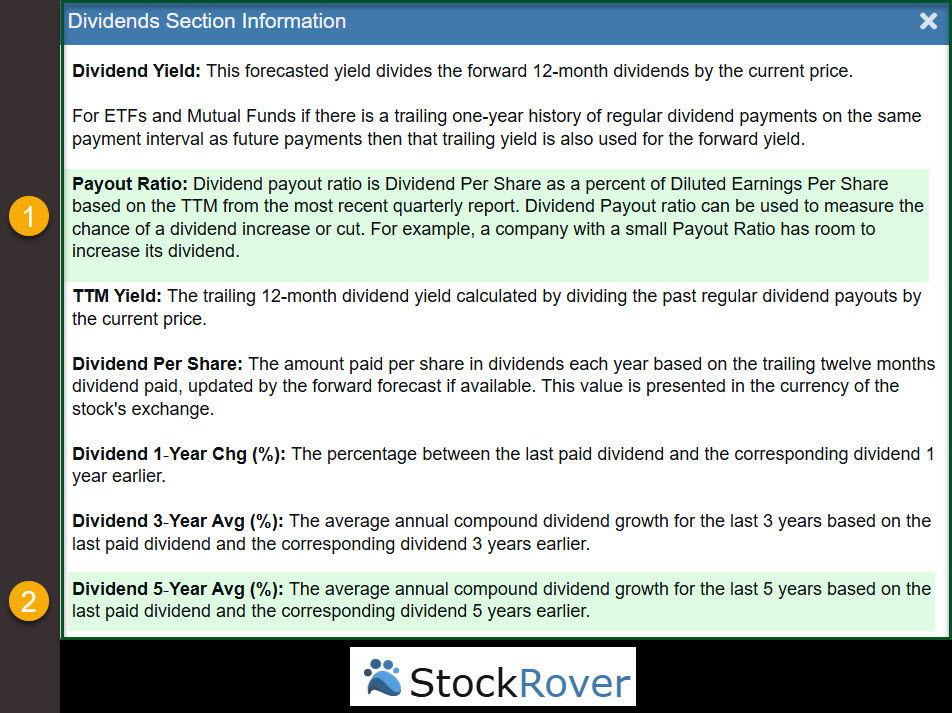
The second, and very important value is the dividend payout ratio. In the simplest terms, this is what percentage of the profits are paid on the dividend. A number greater than 100% is generally not good. This means the company is finding ways to pay the dividend that aren’t completely from earnings. If that continues the outcome is usually very ugly.
The third, and very interesting value is the five-year dividend growth rate. In general, as a dividend growth investor, I want to see this number above five percent. There are exceptions to this rule, especially for some financial stocks like BDCs.
Example: Conagra’s Percentages
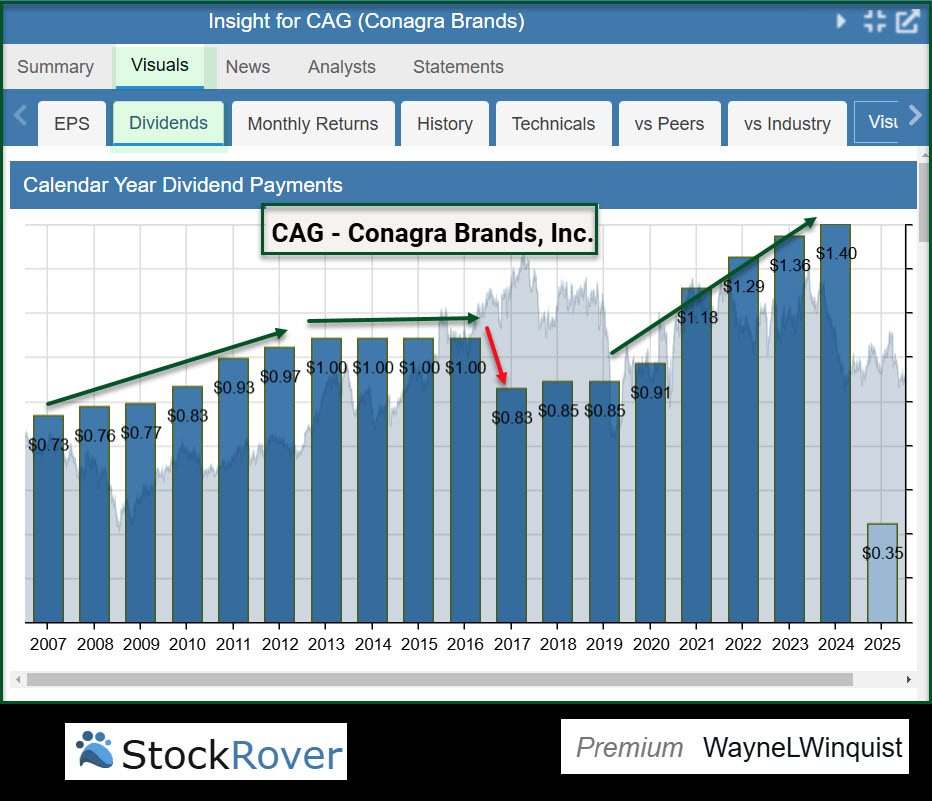
I own shares of CAG, and I have been buying more as the share price dropped. This is not an act of irrational thinking. I see long-term value in the CAG brands.

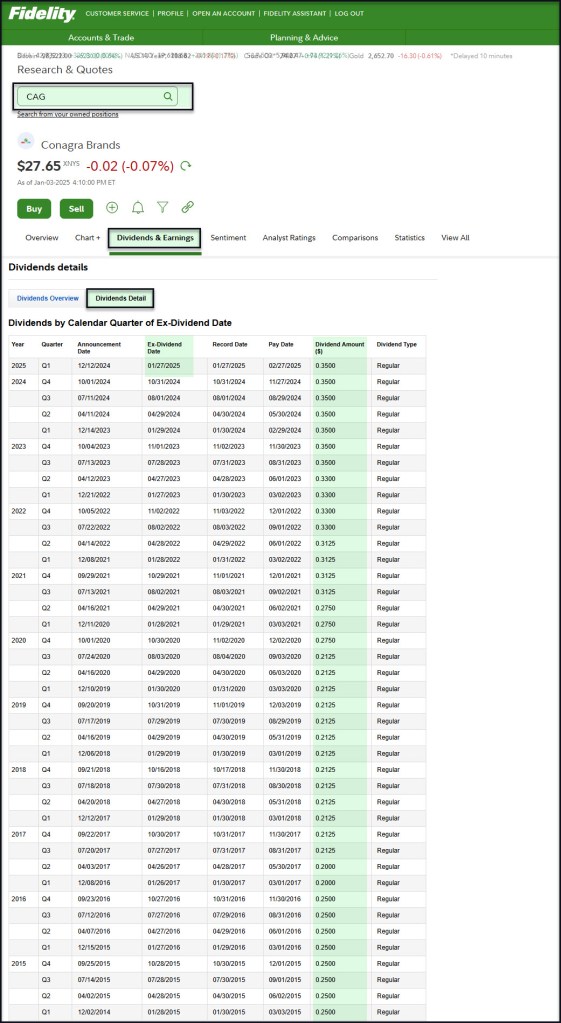
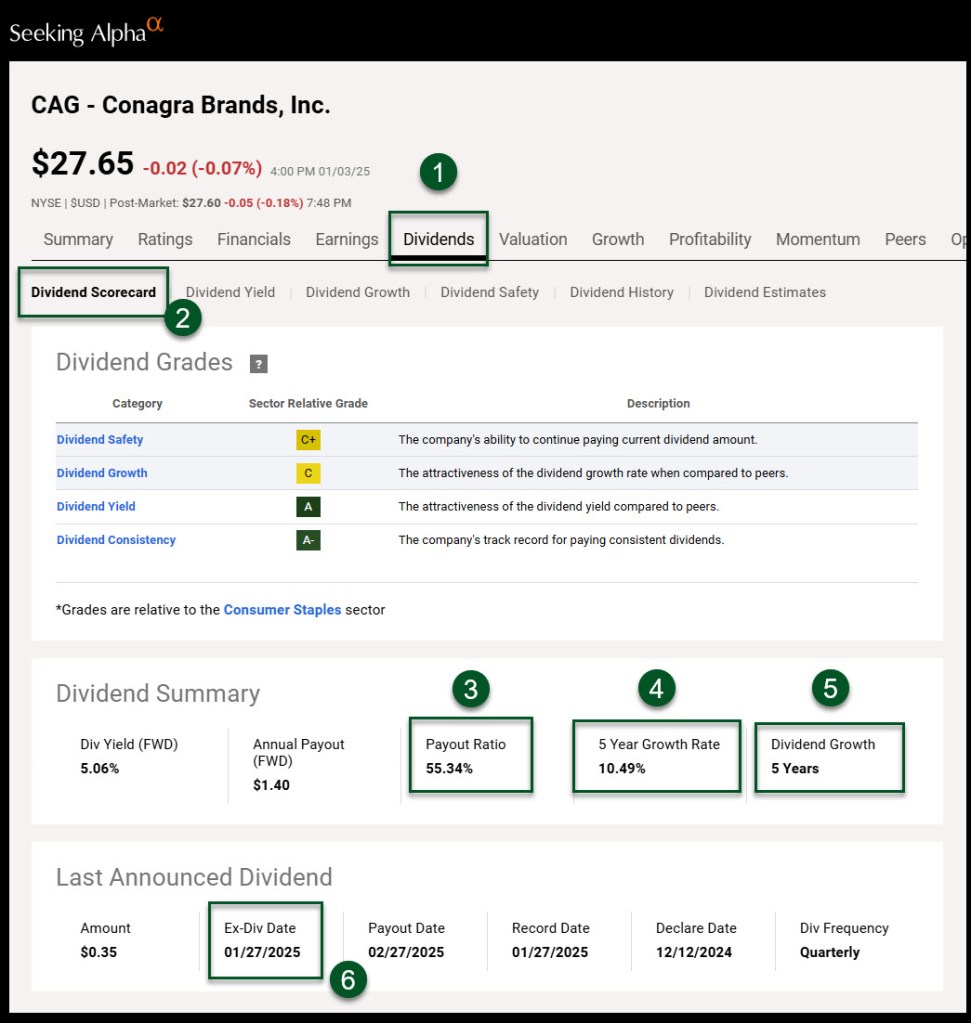
Conagra has a good yield at 5.06%. The five-year dividend growth rate is a rational 10.49%. However, depending on which site you reference, CAG either has a dividend payout ratio of 55.34% (Seeking Alpha), a ratio of 135.9% (Stock Rover) or a ratio of 135.92% (Fidelity.) I have learned to be a bit skeptical of the Stock Rover and Fidelity payout ratios. I’m not saying that they are wrong (they are confusing), but for me the comparison should be EPS versus dividends. I can get that on Seeking Alpha. Most of the time Seeking Alpha shows the valid dividend payout ratio.
To confirm my suspicions, I prefer to look at the Seeking Alpha summary page. The two values I look at are EPS (FWD) $2.46 (earnings per share) and Div Rate (FWD) $1.40. As you can see, the EPS are more than adequate to cover the forward dividends to be paid.
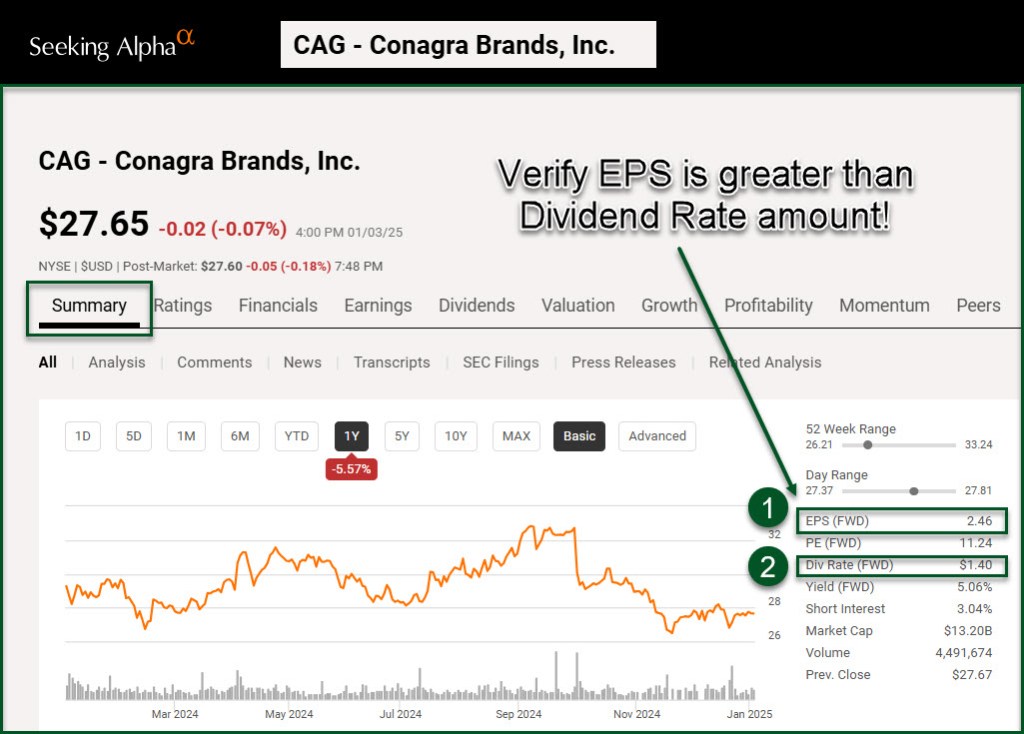
The current CAG dividend is $0.35 per share. The EPS estimate for next quarter is $0.59. CAG tends to beat the estimate from the analysts, but not always.
Now For Ideas
One of the best places to get good investment ideas is Seeking Alpha. For example, this Brad Thomas wrote “My Top 10 BDCs For 2025.” As I reviewed his list, I have to agree. We own some of the ones he mentioned. He discussed ARCC, MAIN, BXSL, CSWC, HTGC, FDUS, OBDC, CGBD, MSDL, and KBDC. Brad Thomas is the author of REITs For Dummies, and Adjunct Professor at New York University.
Notice his reference to percentages: “There are strict rules BDCs have to follow, like investing 70% of their assets in non-publicly traded companies, and like REITs, they are required to pay out 90% of their income in the form of dividends.”
He wrote this about MAIN: “The BDC declared dividends for the 1st quarter in 2025 of $0.75. This represents a 4.2% increase from the previous year’s quarter.”
We hold shares of ARCC, MAIN, CSWC, OBDC, and CGBD. I also own shares of CAG.
