
A History Lesson Regarding Inflation
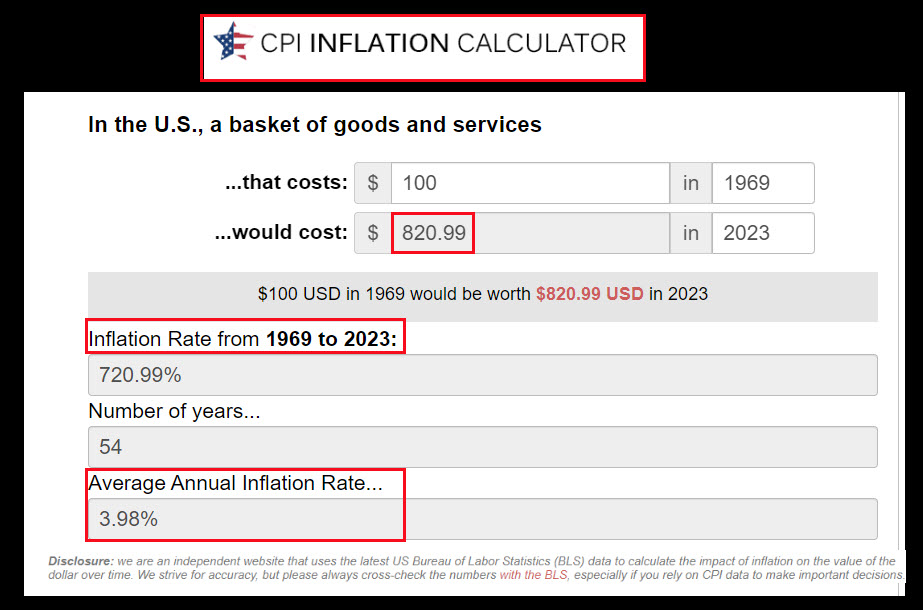
I graduated from high school in 1969. In the ensuing 54 years inflation, as reported by the government, has averaged 3.98%. That might not mean much to younger investors, but it means that I now need over $8 to purchase something in 2024 that would have cost me $1 in 1969.
Inflation doesn’t always show up in price. For example, a Hershey’s candy bar in 1969 was bigger than the ones I see in the stores today. One way that the price of goods appears to be less frightening is that you get less product for your dollar.
Inflation is Variable
Consumers can be lulled into a false sense of security when inflation is low. For example, from 2013 through 2020, inflation seemed like no big deal. If you bought an annuity in 2015, when inflation was less than one percent, you might have rejected paying extra for inflation protection. That would be a painful mistake.
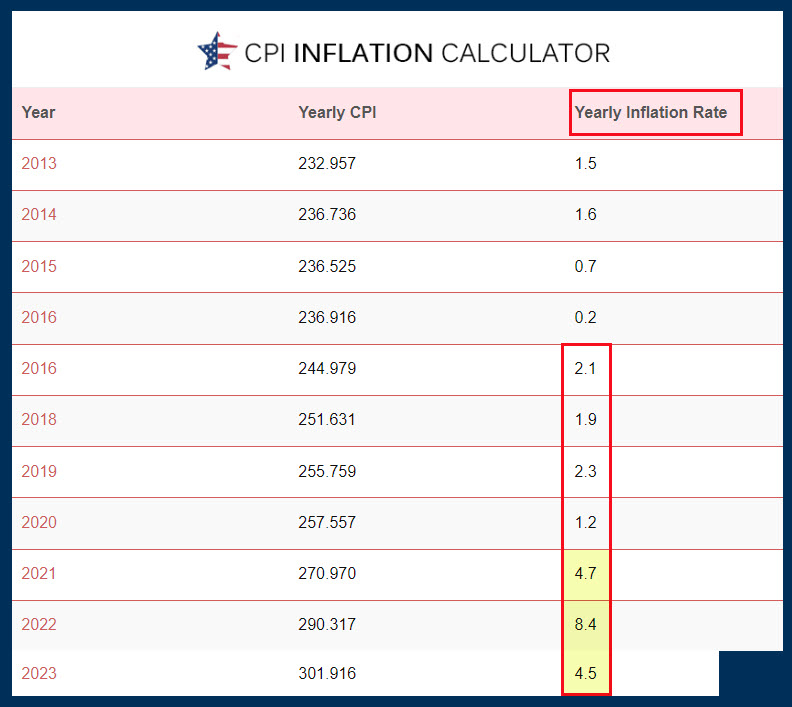
From 2021—2023 most consumers received a wakeup call. The prices for groceries and auto insurance have skyrocketed. If you could fill your grocery cart for $100 in 2020 (and you probably couldn’t), you are probably paying at least $120 for the same groceries today. That might be good, as it might cause you to go on a diet, but that is no way to think for the long term.
What Can an Investor Do?
Every time I buy an investment, I think about both the growth in the value of the investment and the growth in the income from the investment, if the investment pays a dividend. My overall goal for annualized growth in our retirement portfolio is eight-to-nine percent.
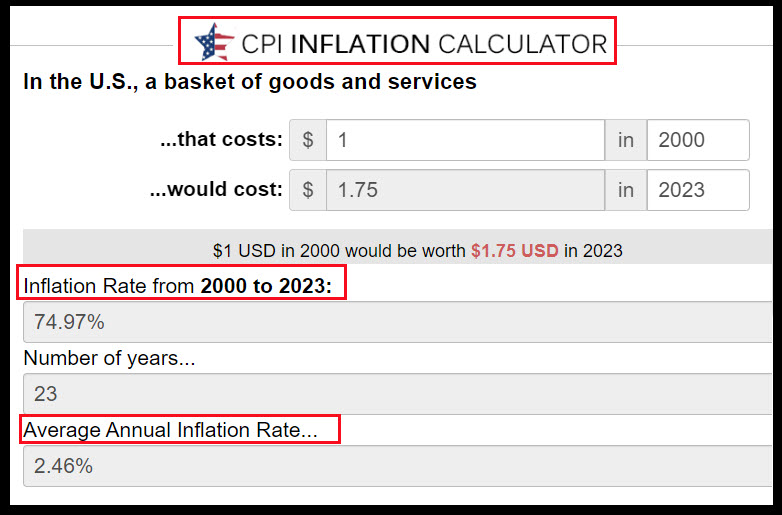
If we look at inflation from 1969 through 2023, we can see that the average annual inflation rate is about four percent. Therefore, choosing any investment that has less than an annual growth rate of four percent means you are losing money against the rising tide of inflation.
When I use the Seeking Alpha website, I look at the ten year returns for ETFs and stocks. For example, I own shares of Fidelity National Financial, Inc. (ticker FNF). This investment has a ten-year return of 125.6% and a 5 Year Growth Rate of 9.67%.
ETF VYM has a 5 Year Growth Rate of 5.59%, SCHD has a 5 Year Growth Rate of 13.05%, and DGRO has a 5 Year Growth Rate of 10.18%. In addition, VYM has a ten-year return of 84%, SCHD shows 113%, and DGRO clocks in at 119%.
What Investments Lose Against Inflation?
I’ve said it before, but it bears repeating. Inflation will eat your annuity and your bonds for lunch. The only way I would buy an annuity is if inflation protection was included in the base price. In other words, understand your total cost of ownership before you purchase an investment that will fail to deliver income that at least keeps pace with inflation.
Bonds are another terrible way to lose the battle against inflation. Here is an illustration. Our investments at Fidelity Investments have grown at 8.90% annually in the last ten years.
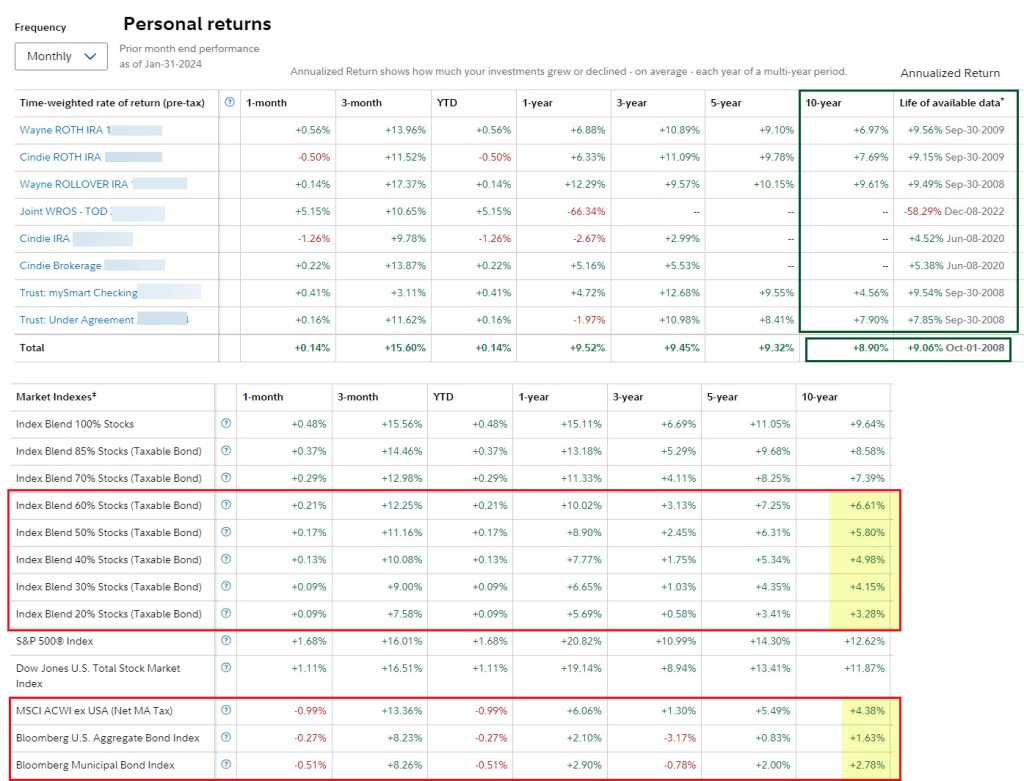
Bloomberg U.S. Aggregate Bond Index has grown 1.63% during that same ten years. The Bloomberg Municipal Bond Index did slightly better at 2.78%. If you only bought bonds, or even had 40% of your assets in bonds, you are not going to keep your buying power. Your dollar will be shrinking.
In my next post I plan to talk about another dividend growth ETF. The ticker symbol for that ETF is DTD. DTD is the WisdomTree U.S. Total Dividend Fund ETF. The ten-year return of that ETF is 100.39% and the 5 Year Growth Rate for DTD is 5.02%. However, don’t rush to buy DTD until you read my next post. There are other factors to consider. Nevertheless, I have started to buy DTD and will explain why it fits in with our total investment mix.
Full Disclosure
Cindie and I own individual dividend-growth stocks and dividend growth ETFs. We currently have about 98% of our retirement funds in these investments and only keep about two percent of our money in money market funds or CDs.
LINK: CPI Inflation Calculator
