

Don’t Believe Everything You Read on the Internet

You may be tempted to skip reading this post, because you already know that everything you read on Facebook, in the Wall Street Journal, or other sources might not be entirely correct. You probably already have a part of your brain that questions the reality of what you read. However, I’m afraid that the same often is not true of the way we look at data about our investments or investments we are considering. Let me illustrate.
Two months ago I noticed that Seeking Alpha, a very reputable source of investing information, was displaying values and percentages for REIT NNN that were clearly wrong. I reported the problem. The first response was “We do not see any discrepancy in the data. Can you please share the source with which you have compared the data so that we may investigate it further?”

In my response I said, “You state that the Annual Payout (TTM) is $1.10. If the quarterly payment is $0.55 for the last four quarters (actually the most recent quarter is higher), then there is no way the TTM is that low. If you look at your Dividend Payout History screen you can see the last four dividends were $0.55, $0.55, $0.55, and $0.565. Add those up to get the TTM.”

I also said, “The dividend growth also seems to be wrong. If you look at your dividend growth graph or at the NNN investor website, you can see that there is growth. However, Seeking Alpha says the 5 Year Growth Rate is -10.35% and the years of growth are 0 Years. That is just silliness.”

Why This Matters
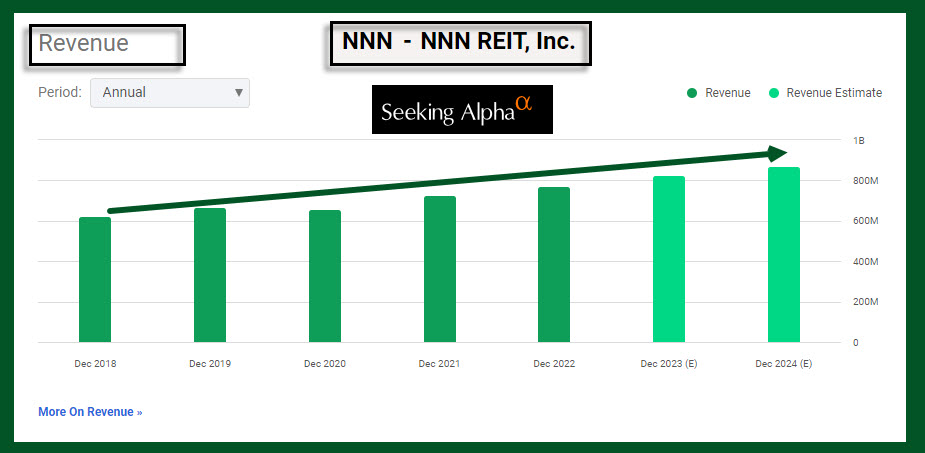
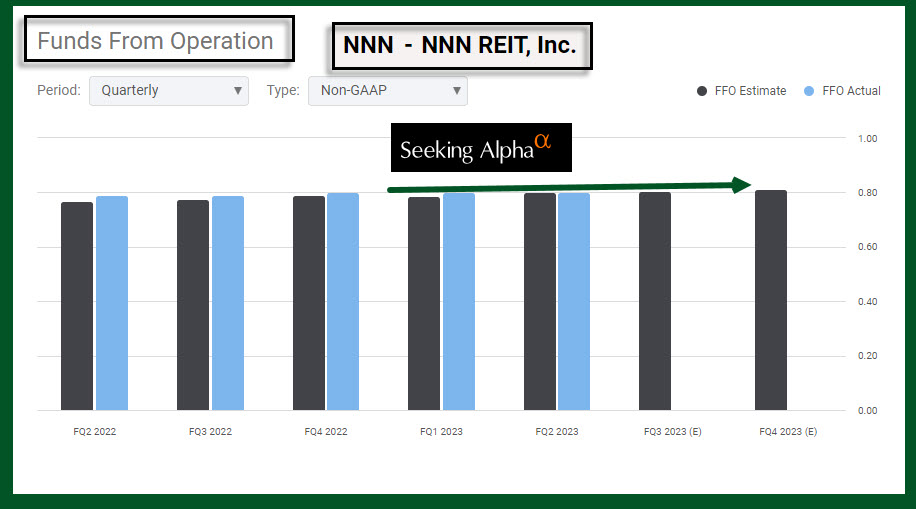
I am a dividend growth investor, so I generally want my investments to pay me more each year. This is part of my Easy Income Strategy. Growing revenues and growing Funds from Operations (FFO) should support growing dividends. If an investment’s years of growth is zero, and the growth rate is negative, I am generally not interested in the investment.
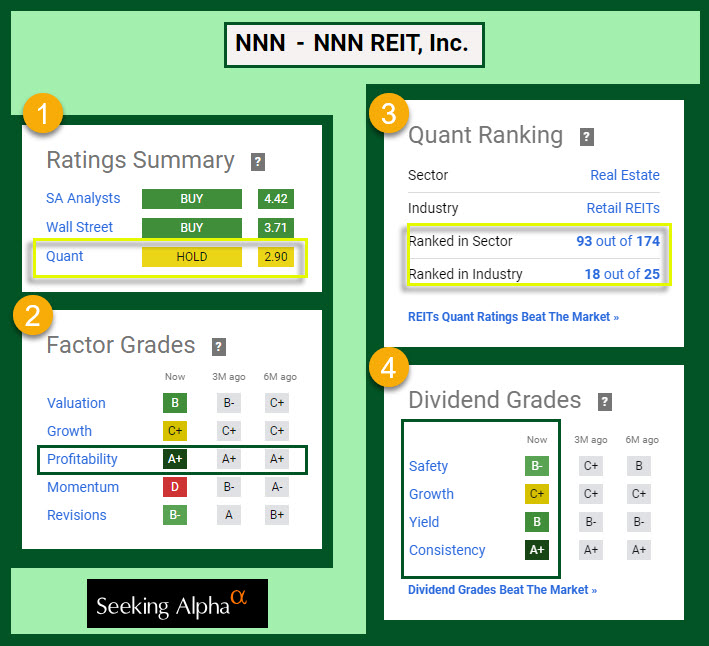
If you go to the NNN website, they tell a different story than the story I read on Seeking Alpha. In fact, even the text on Seeking Alpha says NNN “is one of only three publicly traded REITs to have increased annual dividends for 34 or more consecutive years.” So they say one thing in their company profile for NNN and quite a different thing about the actual data. (Note: Seeking Alpha says 32 years, so although they fixed most of the problems, they are still a bit shy of the real growth in years.)
Company Profile
NNN REIT invests primarily in high-quality retail properties subject generally to long-term, net leases. As of June 30, 2023, the company owned 3,479 properties in 49 states with a gross leasable area of approximately 35.5 million square feet and with a weighted average remaining lease term of 10.2 years. NNN is one of only three publicly traded REITs to have increased annual dividends for 34 or more consecutive years. (This is correct, and I copied this from Seeking Alpha!)
Seeking Alpha Fixed the NNN Data
Here is the correct screen that shows the dividend scorecard.

StockRover Graphs
StockRover presents the data in a most helpful way.


Other Data Elements
You should look for growing revenue, some growth in the FFO, and get a sense as to the potential for earnings growth. I believe NNN has sufficient growth and dividend growth to own shares. Furthermore, the dividend yield of almost six percent is very enticing.

Summary
I have seen errors in data in most sources I use. Thankfully the errors are the exception and not the rule. The idea that should always be in the prudent investor’s mind is “this might not be right.” Do a bit of math in your own head (or with a calculator) if something smells funny.
Full Disclosure
Cindie and I own 1,050 shares of NNN as a long-term investment. I have 350 shares in my ROTH IRA, 600 shares in my traditional IRA, and Cindie has 100 shares in her ROTH IRA. That means the quarterly dividend we receive on our shares is $593.25, or $2,373 annually if the dividend does not change in the next 12 months.
