

Another Great Tool

Far too many live life without a plan or a budget. Part of the problem is that income can vary from month to month. Therefore, the excuse I often hear is that “I don’t know what my income will be, because it varies, so I cannot create a budget.” In retirement this can also be a challenge. However, StockRover is one tool that can help with the budgeting process if you have dividend income. Today I uploaded a fresh version of my traditional IRA positions to StockRover and then used the tools in StockRover to look at my tax-deferred income for the next twelve months.
CSV Files Are Helpful (Spreadsheets)
If you are serious about investing, then I suggest you take the time to learn a few basics about spreadsheets. Trust me, it isn’t difficult to use a spreadsheet. You can easily learn the basics in just a couple of hours. There are many helpful YouTube videos that can get you started. If you have an accountant as a friend, then that person would also be a good resource.
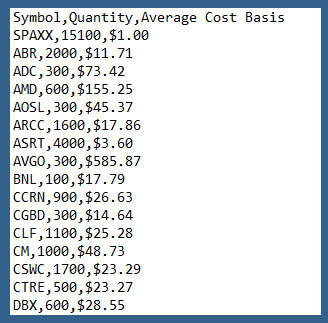
A csv file is a file with a series of columns and rows. The software identifies the columns with commas after each piece of data. This image shows the formatting of a portion of the data I downloaded from Fidelity as a csv file.
Next Steps to Upload the csv file
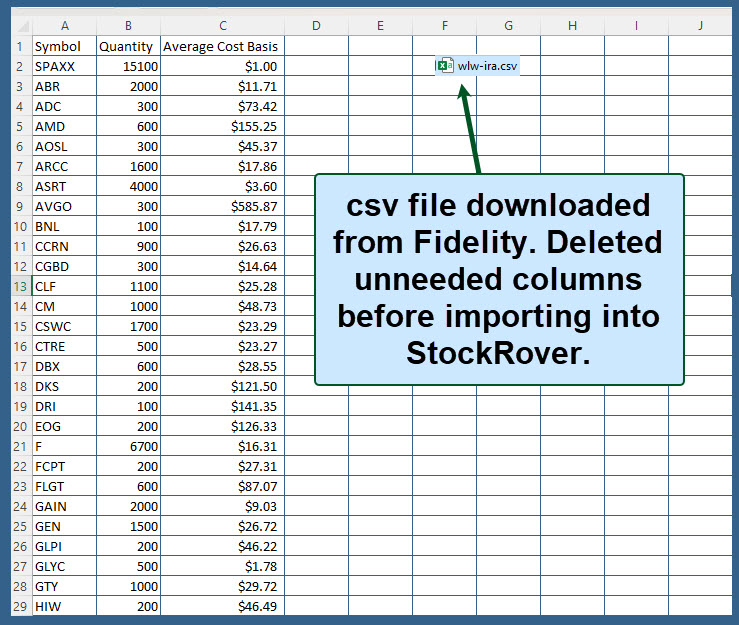
StockRover only needs a couple of columns of data. The required columns are the ticker symbol (like AVGO, or AAPL) and the number of shares you own. It is also helpful to provide the cost basis per share for some tasks. All three pieces of this information come in the csv file from Fidelity. I deleted the other columns of data. When I open the csv file in Excel, it looks like the following.
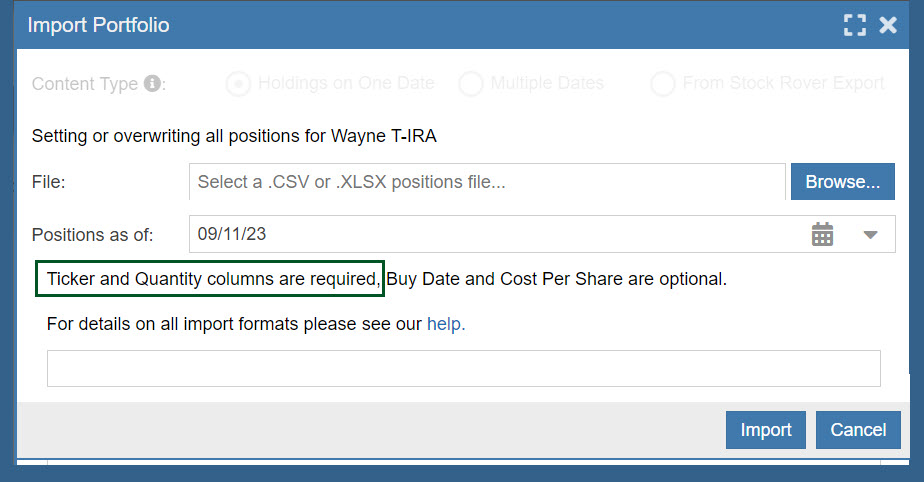
The upload tool in StockRover looks like this.
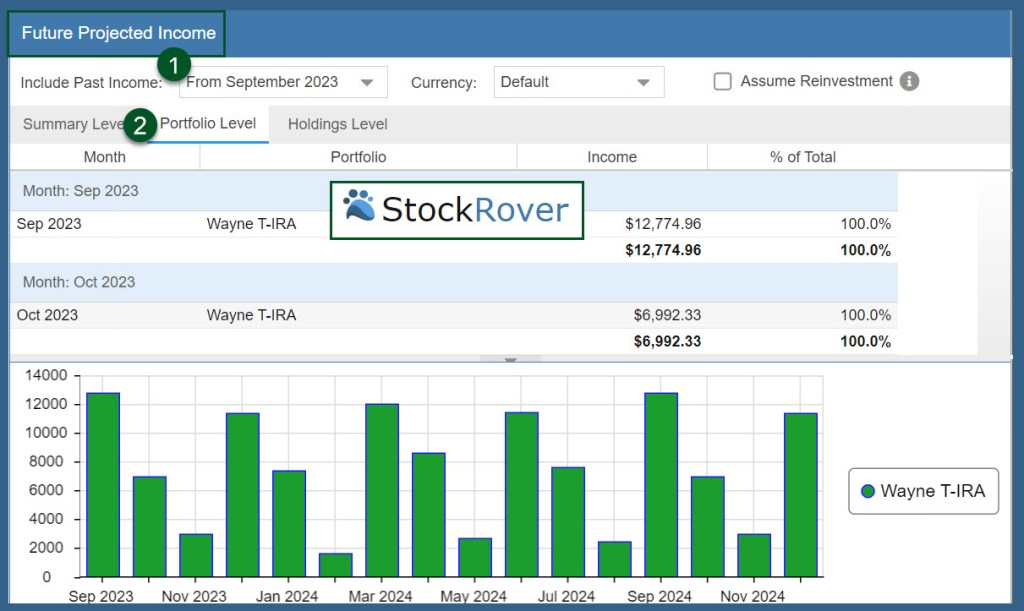
StockRover Graph of my Monthly Dividend Income
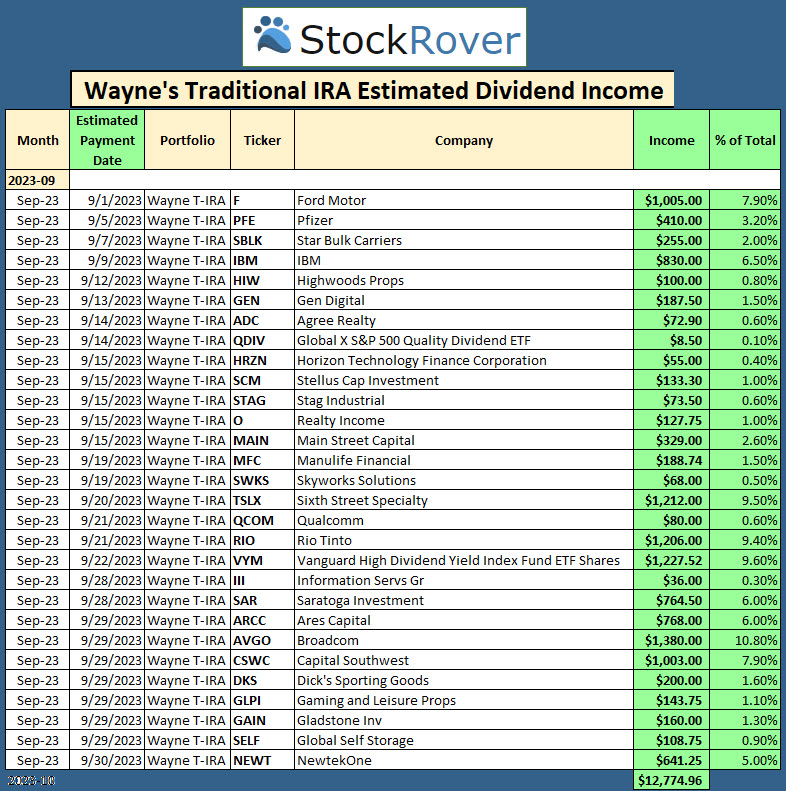
In just a couple of clicks, I could see the way income is likely to arrive in my account during the month of September and for the next twelve months. The first image is a graphical view of the next twelve months. The second image shows the source of the September 2023 dividends and the day I can expect to receive them.
A StockRover Table View
Sometimes the numbers are more useful. StockRover also allows you to download a csv file that shows you the monthly, quarterly, and annual income. In the case of the following image, the remaining 2023 “annual income” is $34,128.20. Next year’s annual income from my traditional IRA is projected to be $88,088.34.
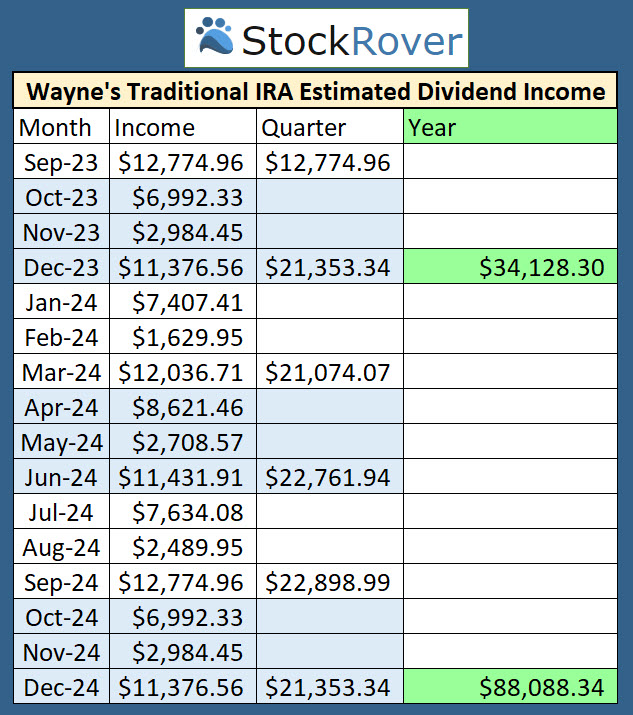
A word of caution is in order. These are projected numbers. They are not guaranteed. There are a couple of reasons for this. Ford, for example, is negotiating with the United Auto Workers union. As a result of their negotiations, they may have costs that increase in such a way that they won’t pay dividends in 2024. Any company can stop or reduce their dividend. Those decisions are made by the company’s board of directors.
Dividends can, and often do, increase. Therefore, these projections cannot include increases as it is impossible to tell which companies will increase their dividend or the percentage of the increase.
In Conclusion
If you don’t have a budget, the right time to start one is now. If you have struggled with understanding your income from your investments, then StockRover might be a tool that can help you visualize your projected income. Finally, I would encourage you to learn how to use a spreadsheet, as that tool will help you budget and invest. For me a spreadsheet it like a jet plane. It can take me up high to see the big picture, and it can help me get to my investing destination.
