

Why Use a GPS?
When we travel, we have a GPS in our 2020 Ford Escape. It has proven to be one of the most useful tools, saving time, helping us know where to turn, and giving us warnings about problems down the road. It helps us steer clear of problems and reach our destination with less frustration. In the same way, Fidelity Investments offers a GPS tool under the “More” dropdown called “Analysis.”
Fidelity’s GPS is a Guided Portfolio Summary

The problem most investors face is knowing what they own. This is especially true if you hold mutual funds and ETFs. When I buy shares of IBM or Ford, I know what type of business I am buying. When I buy a mix of ETFs (or mutual funds), it is hard to know how much I have in the different business sectors. Even if I only own stocks, it can be daunting to know what percentage of the total assets are focused on technology or real estate. The Fidelity GPS can help you with this challenge.
There are several ways to use this tool. The first is just to navigate through the tool and see the results on your screen. The second is to click on a link to download a nice GPS summary report. I think of that as similar to a paper map we used to use when traveling in unknown territory. The third is the ability to download an Excel file for further analysis.
Navigation Step One
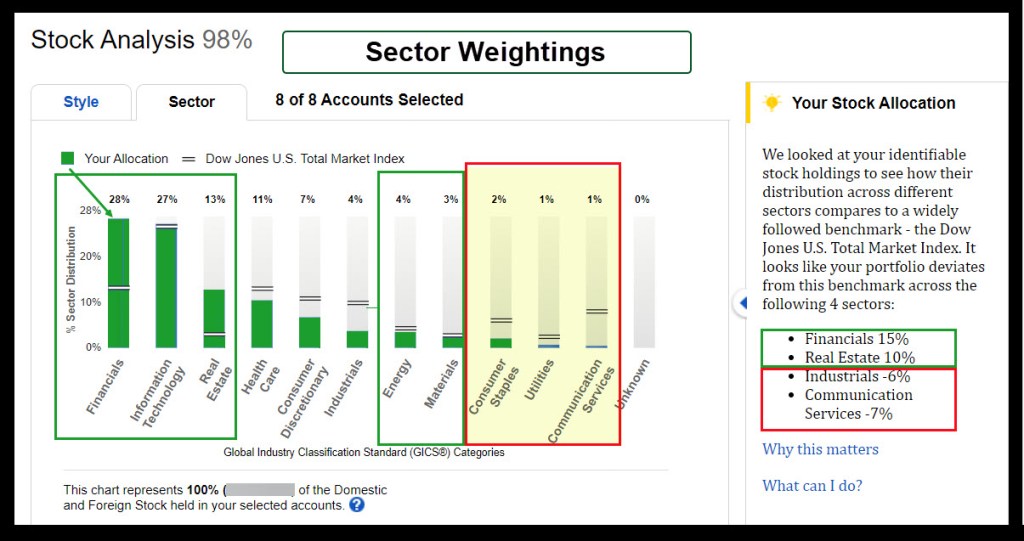
To get to the tool, you simply click on the “More” category and then select “Analysis.” Then, just start clicking around to explore the tool. At the top of the page you will see options for “Summary Views” as the default. You can also select “Stock Analysis” or “Fixed Income Analysis.” The “Stock Analysis” is what I used this morning to look at our holdings.

Under “Stock Analysis” you can look at “Stock Style” or “Stock Sector.” Both are helpful. Stock style helps you see the market cap and valuation styles of your investments. Are you a value investor, a growth investor, or do you have a blended approach? Do you favor large cap, mid-cap, or small-cap investments?
The Stock sector view is also helpful. This is especially true if you hold mutual funds or ETFs. If you own shares of VYM, SCHD, and DGRO, do you know how they fit in the bigger puzzle of your investments? Do you know how much you have invested in real estate or consumer discretionary stocks? This tool will tell you.
The GPS Report
When you are in the tool, you will see a small “Reports” icon in the upper right section of the screen. If you click on this, you will download a complete GPS PDF report to your computer. Our report is 36 pages long, but only about 4-5 pages are needed to understand your investments in general. The summary pages are the first twelve pages. You will be amazed by what you can learn.

The GPS Spreadsheet
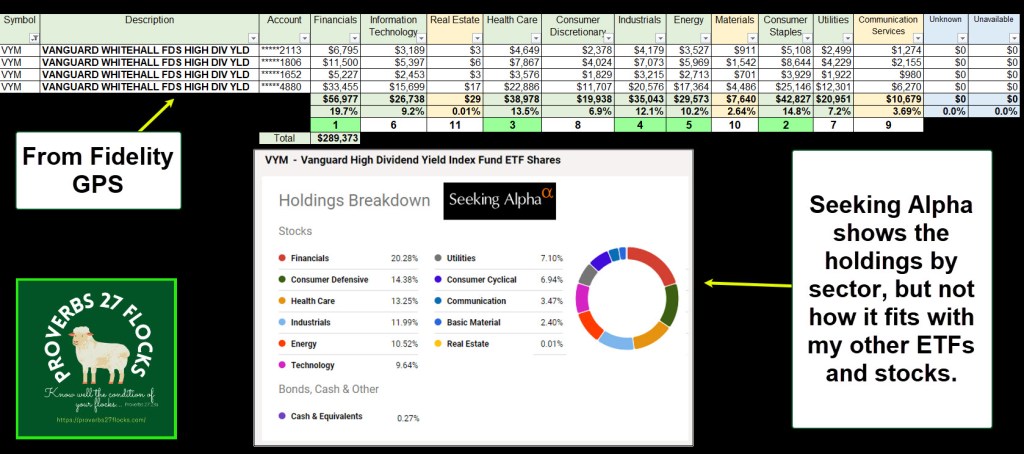
The GPS spreadsheet is a two-sheet download. The first sheet is shown in dollars, and the second in percentages. I used the dollars sheet to produce this view of our VYM holdings.
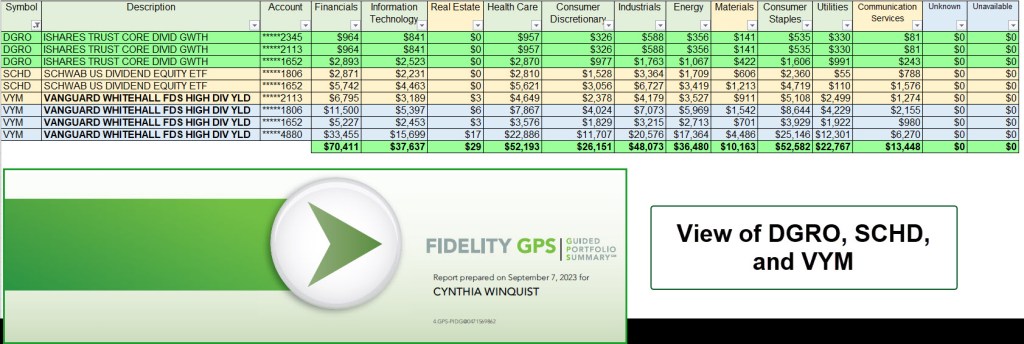
Now the question would be, what do VYM, DGRO, and SCHD do to the picture. Using the same spreadsheet, I filtered for these and see the following.
Some Analysis or Food For Thought
If I only look at VYM, I will know it is diversified. VYM has a heavy allocation in Financials, Healthcare, Industrials, and Consumer Staples. VYM also (unfortunately), includes sectors that I tend to avoid: Utilities and Communication Services. But that is OK because the allocations to these sectors is relatively small. The following image is from Seeking Alpha

Summary
If you are a fan of mutual funds or ETFs, I strongly recommend that you explore Fidelity’s GPS tool. You will learn something about your investments, and this will make you a better, more informed investor.

Hey Wayne — Been with Fidelity for many years and didn’t know this GPS report existed. Thanks so much for introducing it to readers. I’ll bet a lot of folks on the Fidelity Community forum don’t know about it, but should. Really enjoy your Flocks messages and really appreciate your efforts to educate us. Thanks, again…
— jery
>
LikeLike
Hey Wayne — Been with Fidelity for many years and didn’t know this GPS report existed. Thanks so much for introducing it to readers. I’ll bet a lot of folks on the Fidelity Community forum don’t know about it, but should. Really enjoy your Flocks messages and really appreciate your efforts to educate us. Thanks, again…
— jery
>
LikeLiked by 1 person
Thanks for the kind words. Sometimes I wonder what people are thinking and most do not comment. Therefore, your words were both encouraging and reminded me to keep sharing ideas. Have a great day.
LikeLiked by 1 person