When You Buy Tires What Do You Want?

Not all tires are equal. Some are great for winter driving, some for the Indianapolis 500, and some are perfect for the average driver who doesn’t believe in driving like a maniac. Most drivers, regardless of their situation, prefer to buy tires that will perform and that will last. To that end, there is a rating system for tires.
“Treadwear ratings are supposed to help us determine the value of a tire and answer questions like, How long will a tire last? And Is the tire’s expected life worth its price?” SOURCE: www.tireagent.com
How Does Treadwear Relate to Mileage?
Here is some tire humor. “Is there a connection between treadwear and mileage? If a tire is marked with 480 treadwear, how many miles will it get? No tire dealer worth its weight in rubber will tell you how many miles any tire will get. There are many factors that affect a tire’s expected life in terms of mileage.” SOURCE: www.tireagent.com
The Mileage and Treadwear of Mutual Funds

In the same way, there are many factors that affect an investment’s “mileage” and “cost.” These are the growth factors and the expenses the fund charges to create and manage the mutual fund or ETF. To get a sense as to the mileage you might receive from an investment, you can use rating tools at Fidelity Investments, AAII, Seeking Alpha, StockRover, and Weiss Ratings. There is no single best source for the objective ratings of mutual funds, but I prefer the AAII Journal.
Another choice for a quick “Grade” is Weiss Ratings. Weiss is good for stocks, ETFs, mutual funds, banks, and insurance companies. The grades Weiss provides are A, B, C, D, and E. A and B are buy ratings. “C” is a hold rating. D and E are “are you out of your mind?” ratings. In other words, don’t buy a mutual fund that is rated D or E.
Some Rules of Thumb
The first thing I like to do when I help an investor is to review their current holdings. I want to know what they own and how much they own of every piece of the pie. I want to see if there is overlap in their mutual funds that they have not noticed. This is important because many mutual funds hold the same investments in their top ten. For example, the “Holdings Channel” shows that shares of AAPL (Apple) are held by 4,493 funds. 2,878 funds hold TSLA shares. 4,692 funds hold MSFT. If you aren’t careful, you might think you are diversified by owning five different mutual funds. You will be, but you may be shocked to learn that you have a heavy allocation of AAPL, TSLA, and MSFT shares.
There are at least two other quick looks that I do. One is to look at total returns (price return plus dividends) and expenses. In the universe of mutual funds there are many, dare I say most, that help you lose money. If you are paying a high expense ratio and the 10-year returns are awful, you are paying the fund manager to mismanage your retirement assets.
To help illustrate the dangers, I selected eighteen funds from two individuals who came to me for advice. Some of the funds were awful, and some were quite good. For example, in my opinion, DWGAX and TTMIX are not worthy of your investing dollars. DWGAX is especially repugnant.
On the flip side, PRWAX (T. Rowe Price All-Cap Opportunities Fund No Load) has a ten-year total return of 331.90% according to recent figures on Seeking Alpha.
The Rule of 72
Do you want your money to double? Then don’t buy bonds, CDs or stick your hard-earned money in a savings account. The following illustrates why you want to be more focused on stocks, mutual funds, and ETFs with a good 10-year average track record of 10% annualized returns. If you can get 10% returns, you can double your money every seven years. If you are twenty years old, and plan to retire at age 65, your retirement assets can double six times over your working years.

AAII Mutual Fund Issue
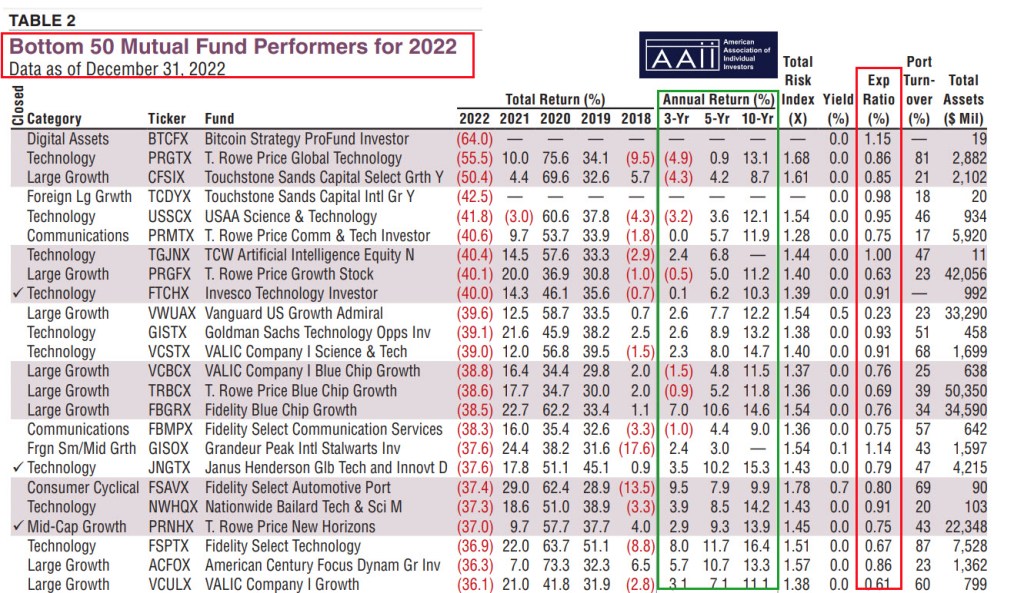
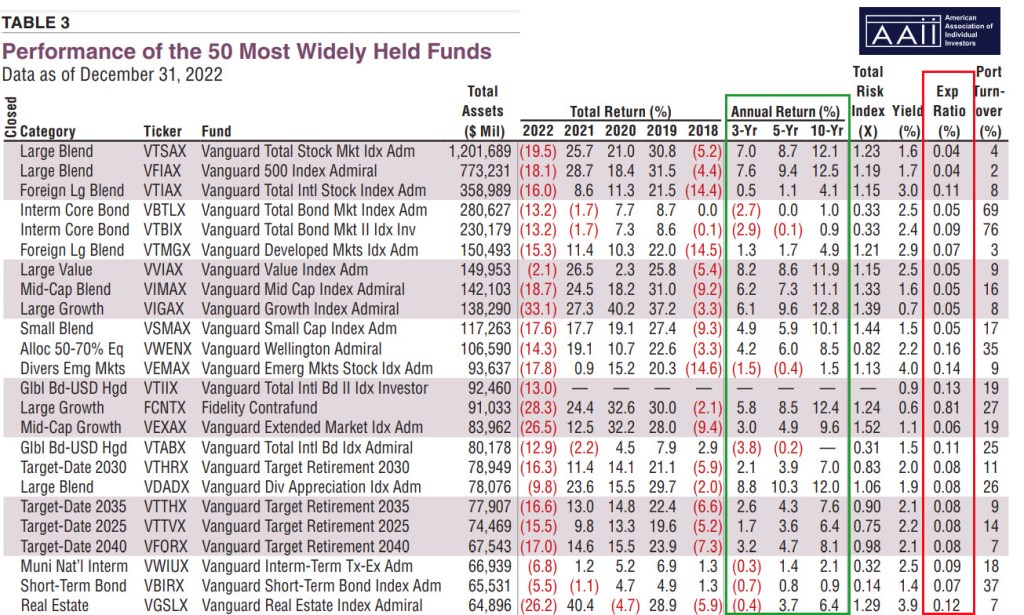
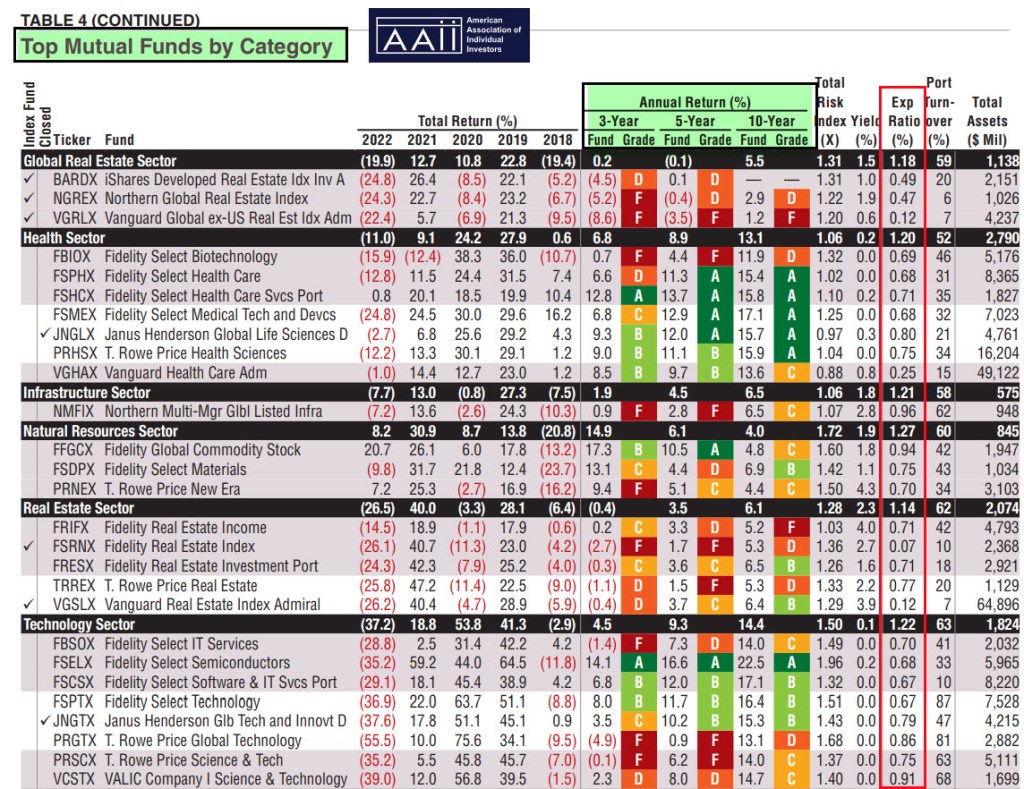
We will begin by looking at a resource from AAII. The next three images show how the AAII Journal slices and dices the different mutual funds. The mutual fund issue comes out once each year. Don’t spend too much time on this. Just notice that this is a quick way to see 1) The Bottom 50 Mutual Fund Performers for 2022 (TABLE 2). You would do well to also notice that several of these funds have good 10-year returns, albeit high expense ratios. 2) TABLE 3 shows the performance of the 50 most widely held mutual funds. A quick glance tells you that most of the funds are offerings of Vanguard. I like Vanguard for both performance and low expenses. However, be careful as some of these are bond funds. 3) TABLE 4 is a list of Top Mutual Funds by Category. This table is many pages long, so this is just a quick look so that you can see the value of the AAII Journal.
Weiss Ratings
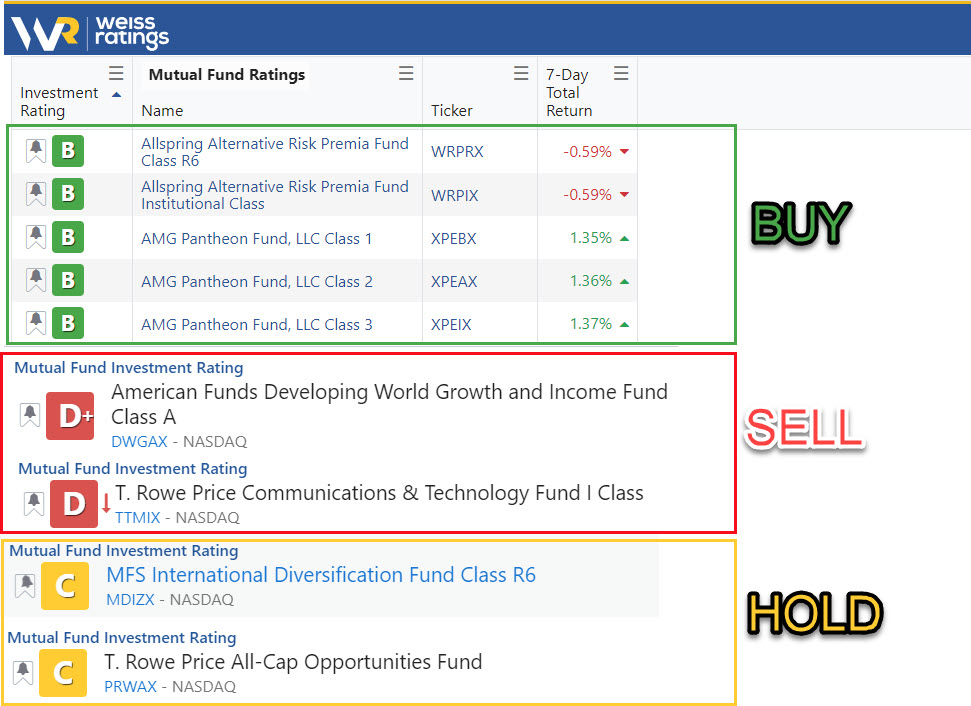
Weiss is a pit stop on the treadwear and value tour. The best thing about Weiss is they offer a single letter grade that is familiar to most Americans. Here is an interesting look at some mutual funds with “B” ratings, and then four of the eighteen funds in our sample that have less than desirable ratings.
What Expenses Do To Your Results
Never think that an expense ratio less than 1% is inconsequential. To illustrate this point, look at the columns labeled 2, 3, and 4. Column 2 is the expense ratio for the eighteen sample mutual funds we have considered. If you have $100,000 invested in any one of these, you can see what you will pay in expenses over the course of ten years by looking at column 3. The actual value might be much higher if your fund grows in value. It might be less, but don’t let that be cause for rejoicing. That only means your $100,000 is no longer worth $100,000. If you buy shares of DWGAX, your 5-year returns are awful and you are paying 1.21% for those returns. That means, in the course of ten years, your $100,000 investment will cost you $12,100 in expenses. Ouch!
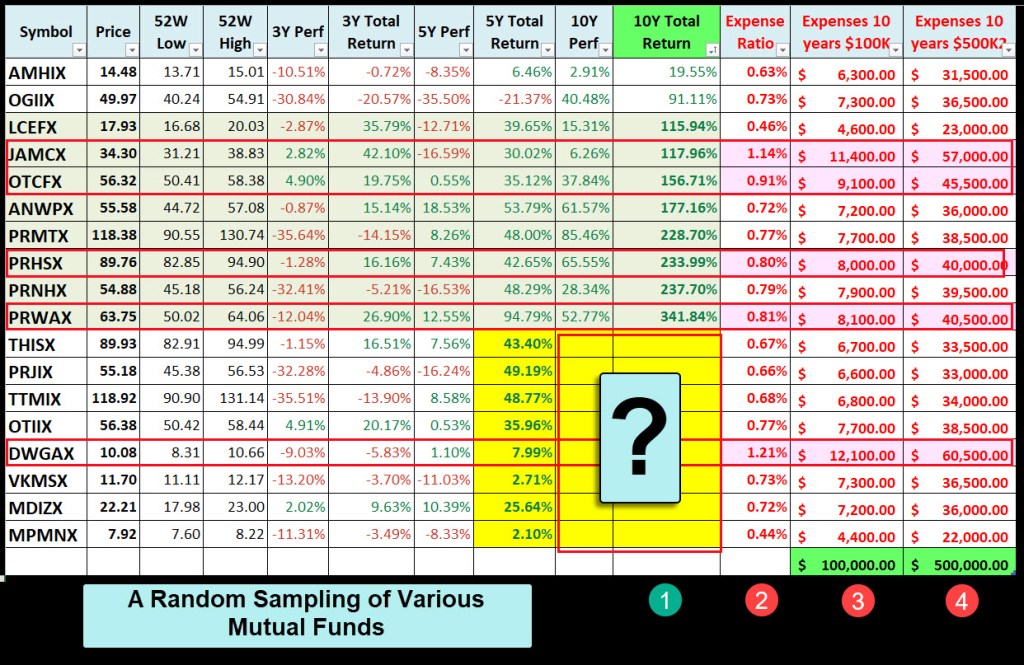
Then look at the column labeled “4” to see what the costs will be if you invested $500,000. Now you might think “I don’t have $500K. I realize that. However, what you need to understand is that you are paying more for the very same services that the person with $100K paid. Let that sink in. The more you have, the more they take.
Total Returns Matter
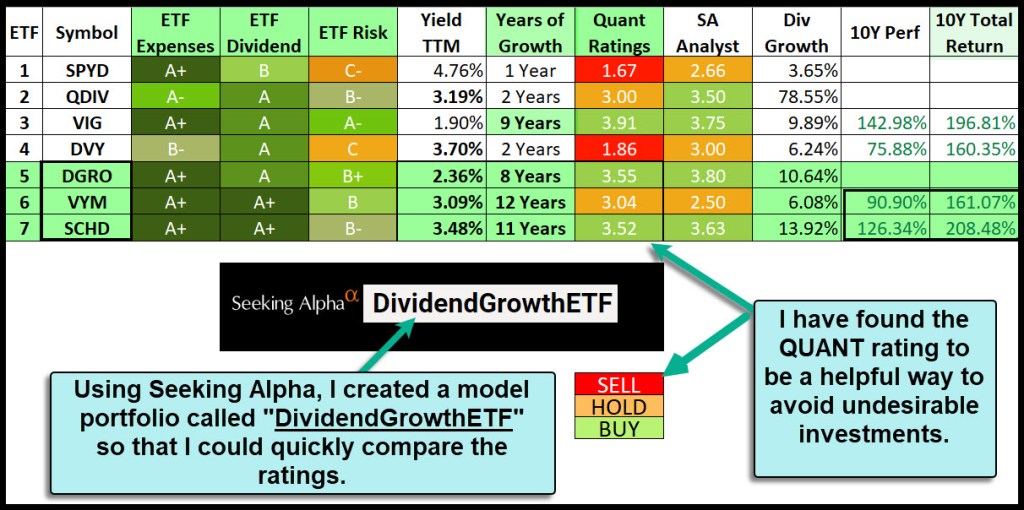
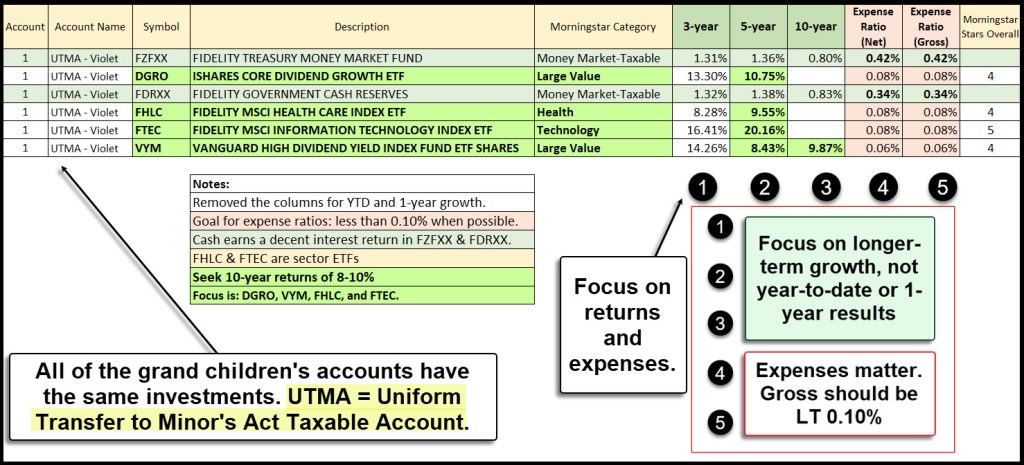
One of the reasons I buy dividend growth ETFs is that I want both growth and dividend growth. VYM, SCHD, and DGRO offer these attributes and the also have low expense ratios. Here are the types of holdings we have in the typical UTMA accounts for our grandchildren, Cindie’s ETF holdings, and my ETF holdings. Pay attention to the ten-year returns (or in the case of DGRO, the five-year returns.) These returns help us to double our wealth about every 6-7 years.


This next image is from Seeking Alpha. It shows the primary funds in our accounts (DGRO, VYM, & SCHD) along with the returns and the years of dividend growth. Dividend growth, I submit, is an important piece of your inflation protection strategy.